A positive trend continues for the fifth month in a row, with more and more and more aircraft coming out of storage. The total global fleet currently counts 27,790 aircraft, out of which 21,135 are active and 6,655 grounded. If we compare these numbers to May 2021, we can see the number of active aircraft has increased by another 5%, while the number of grounded aircraft has decreased by 12%.
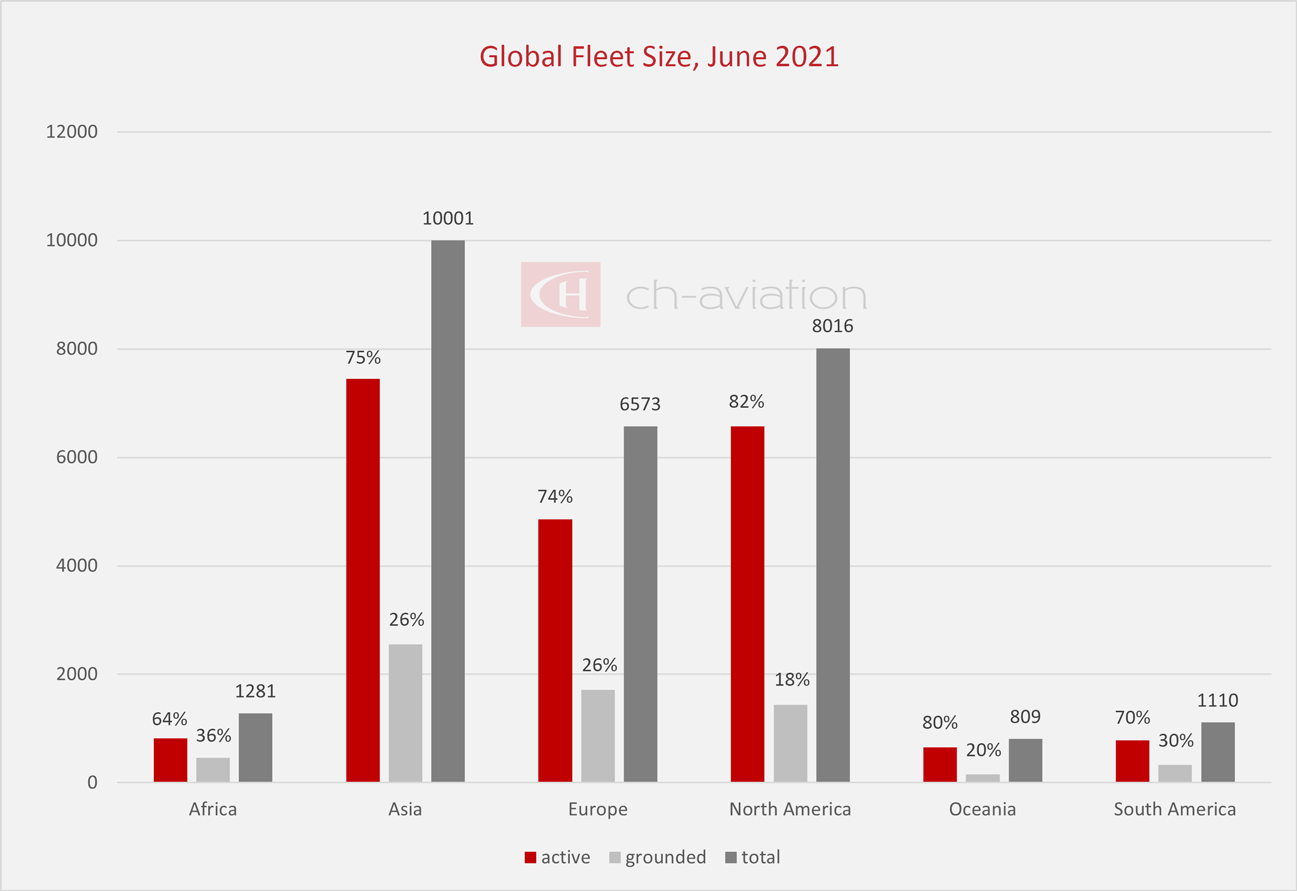
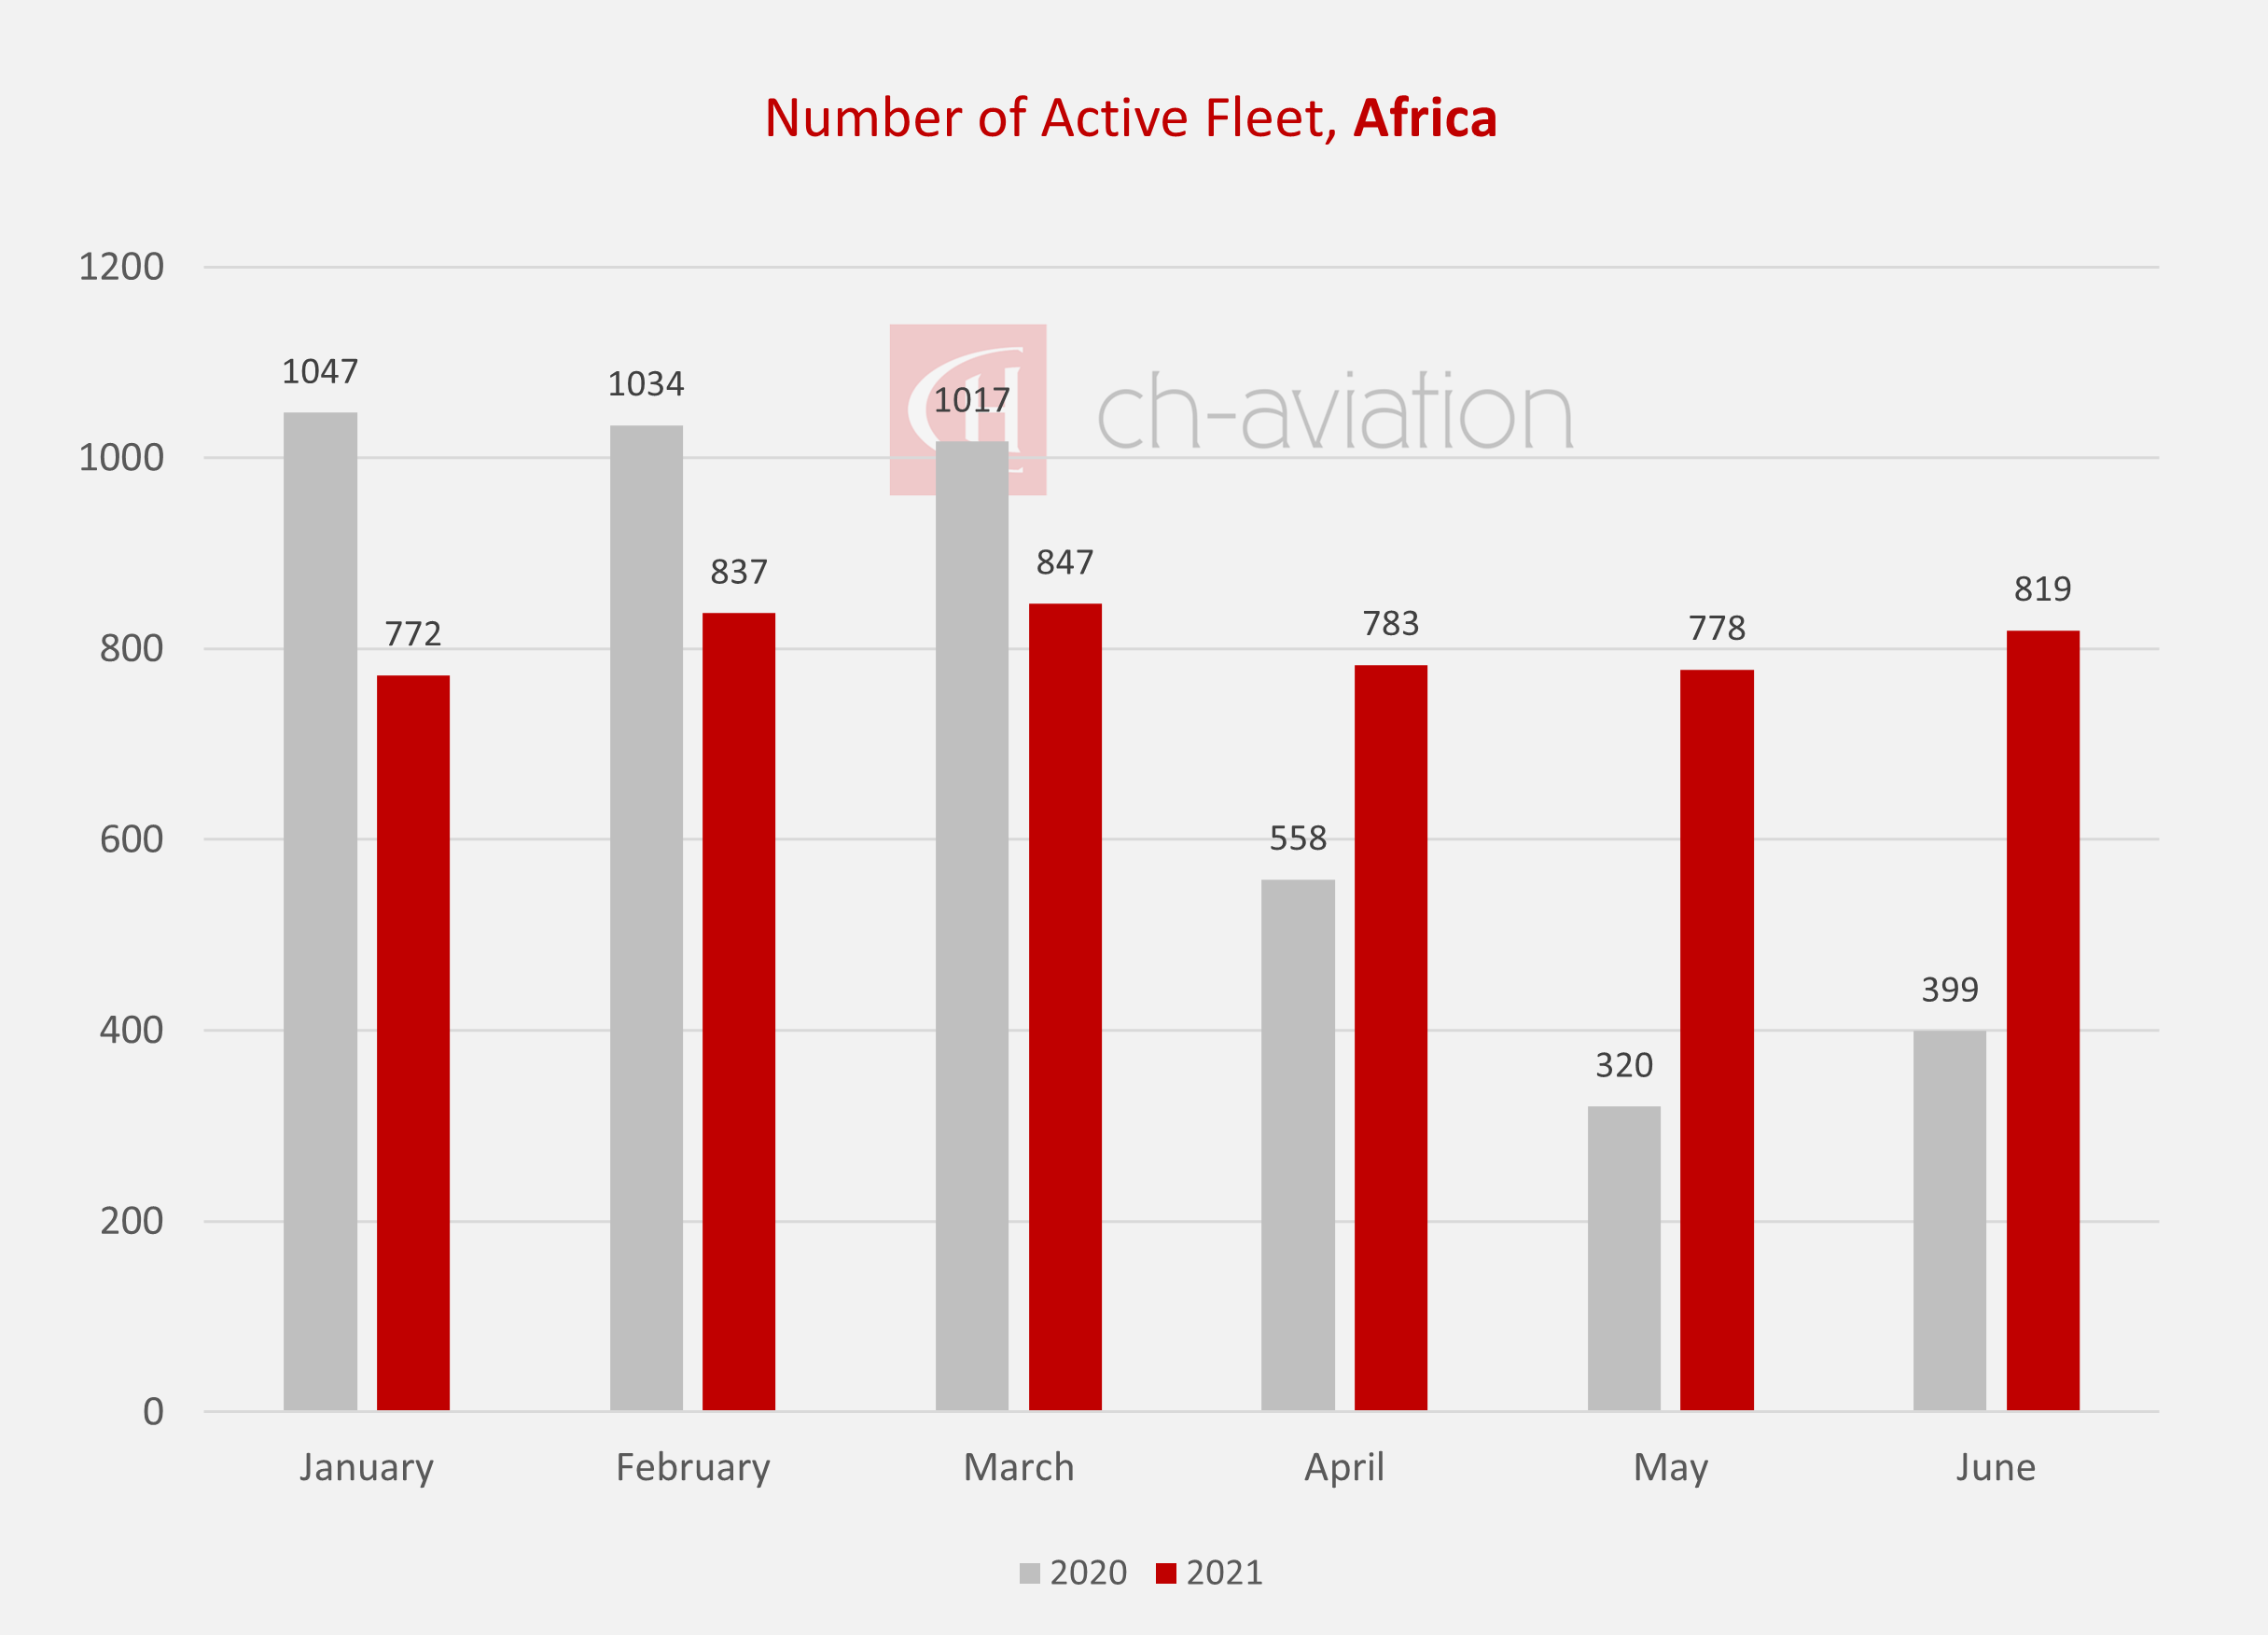
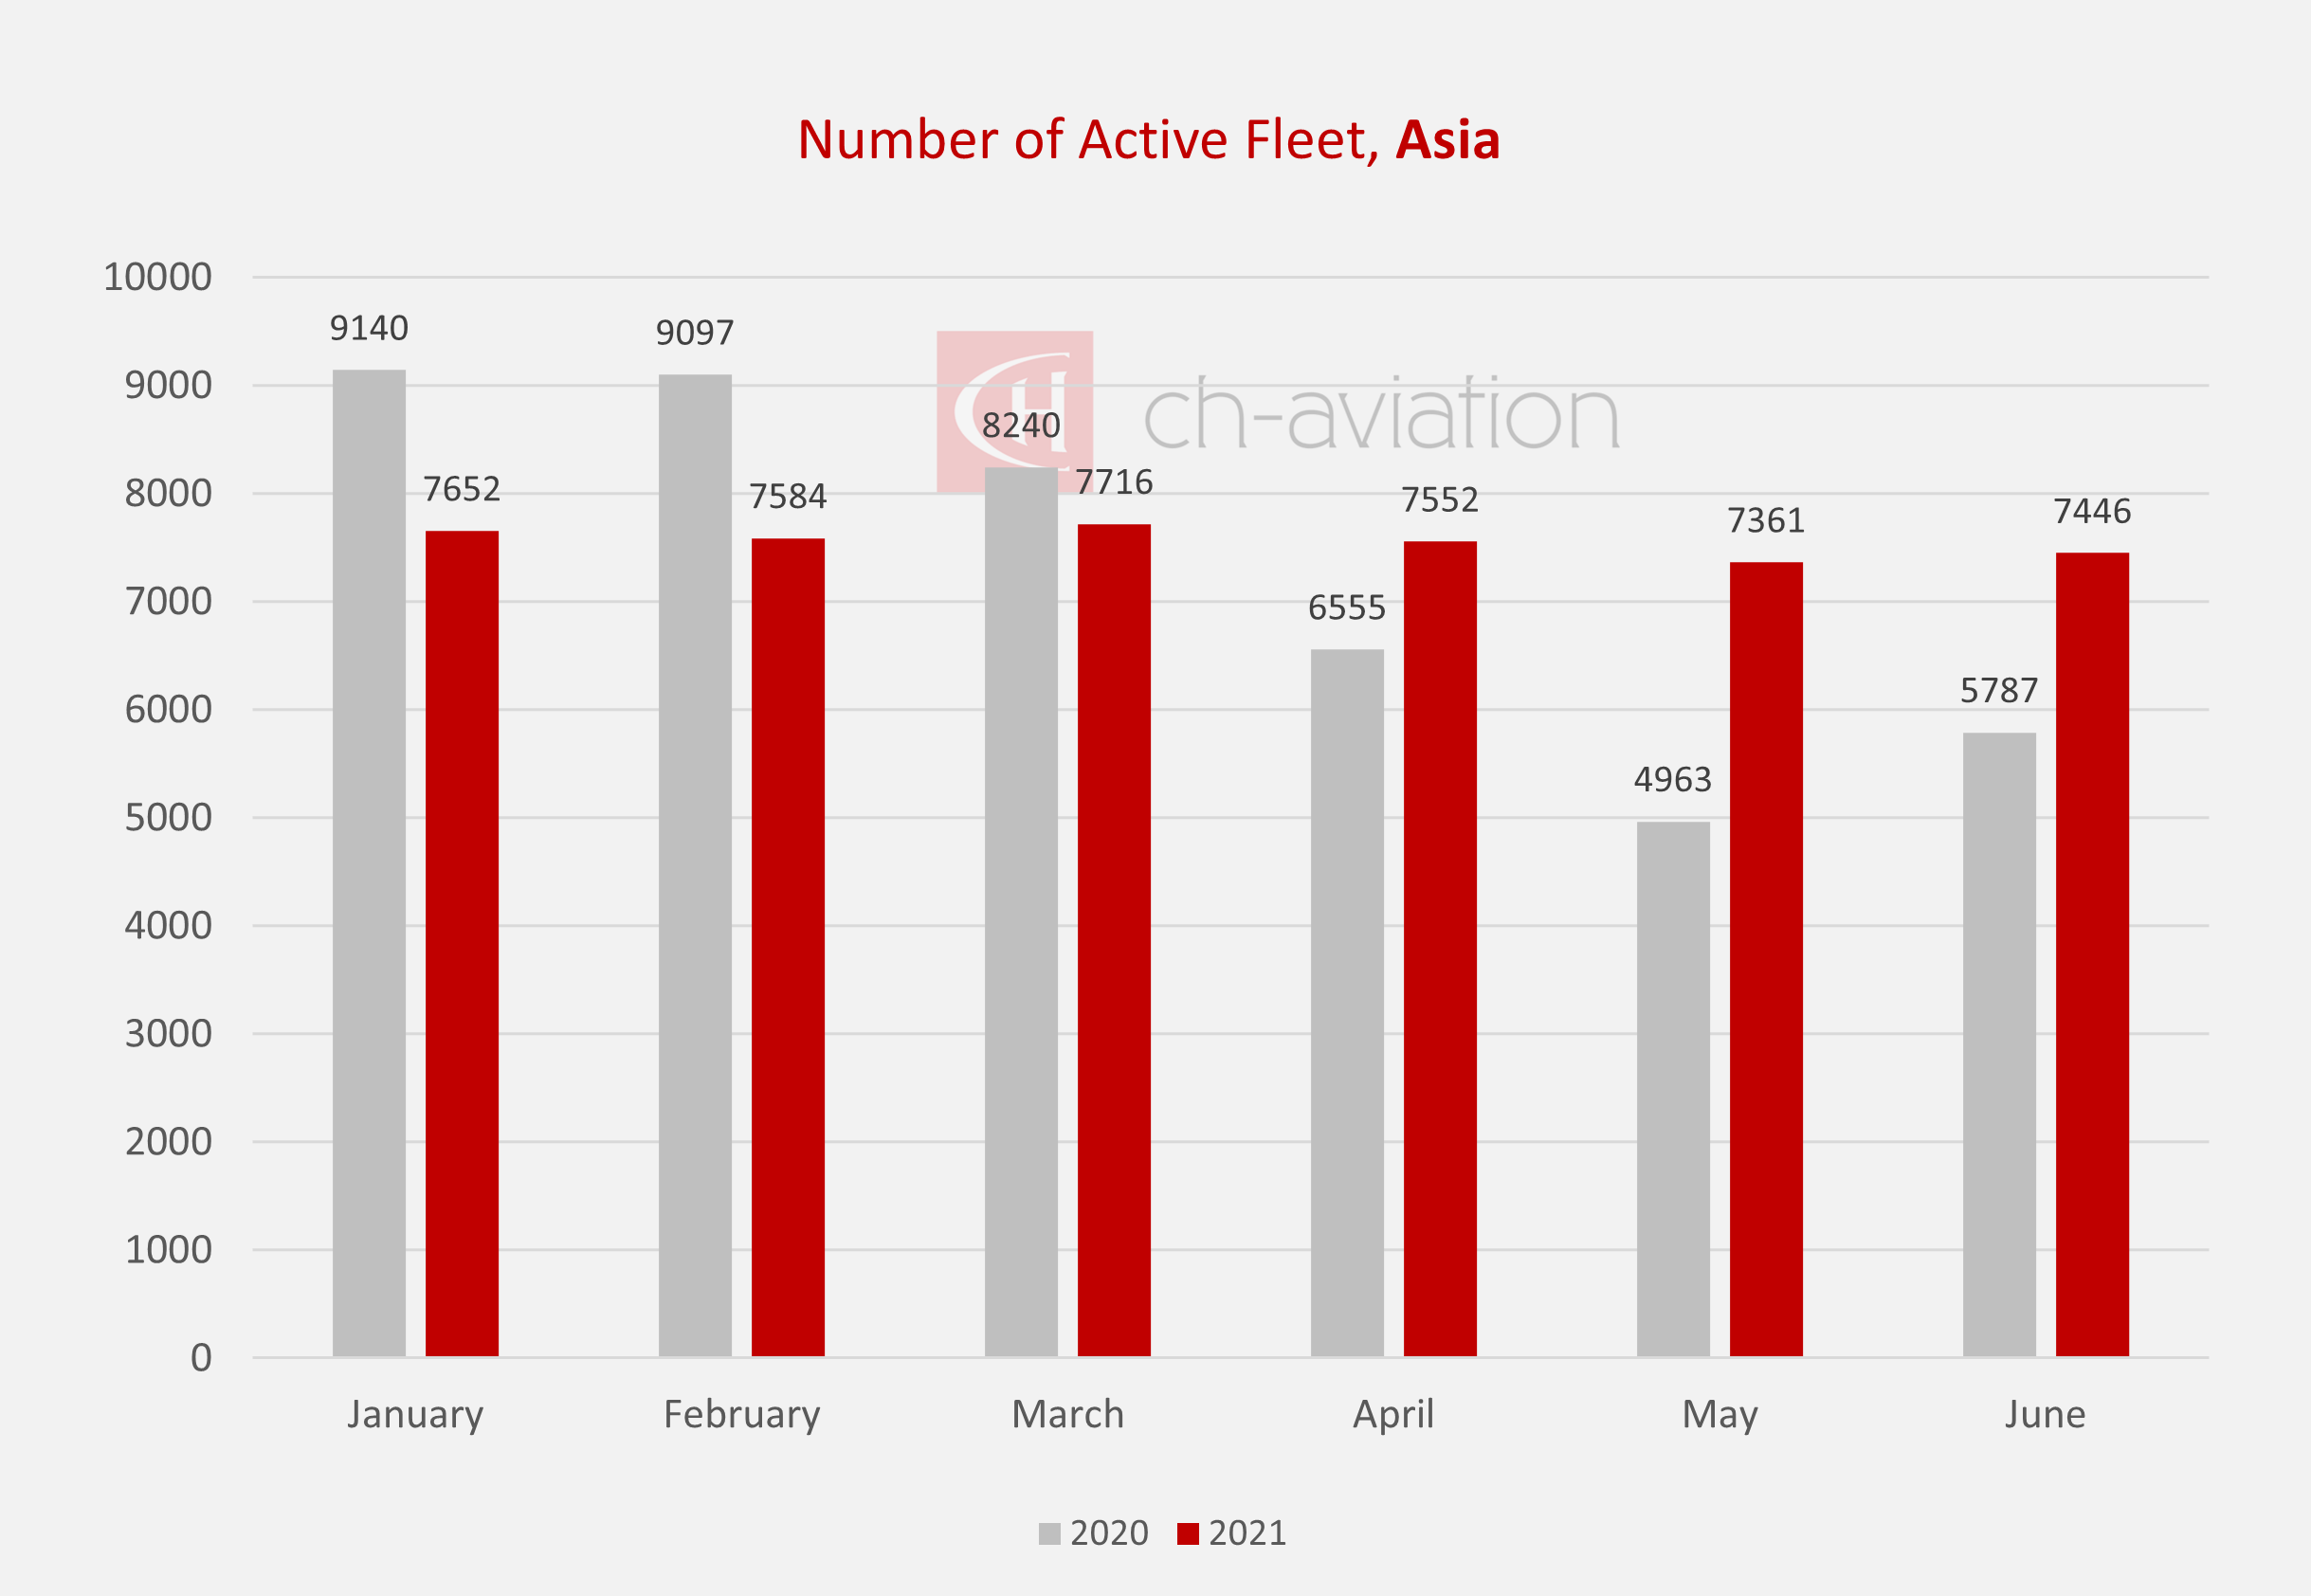
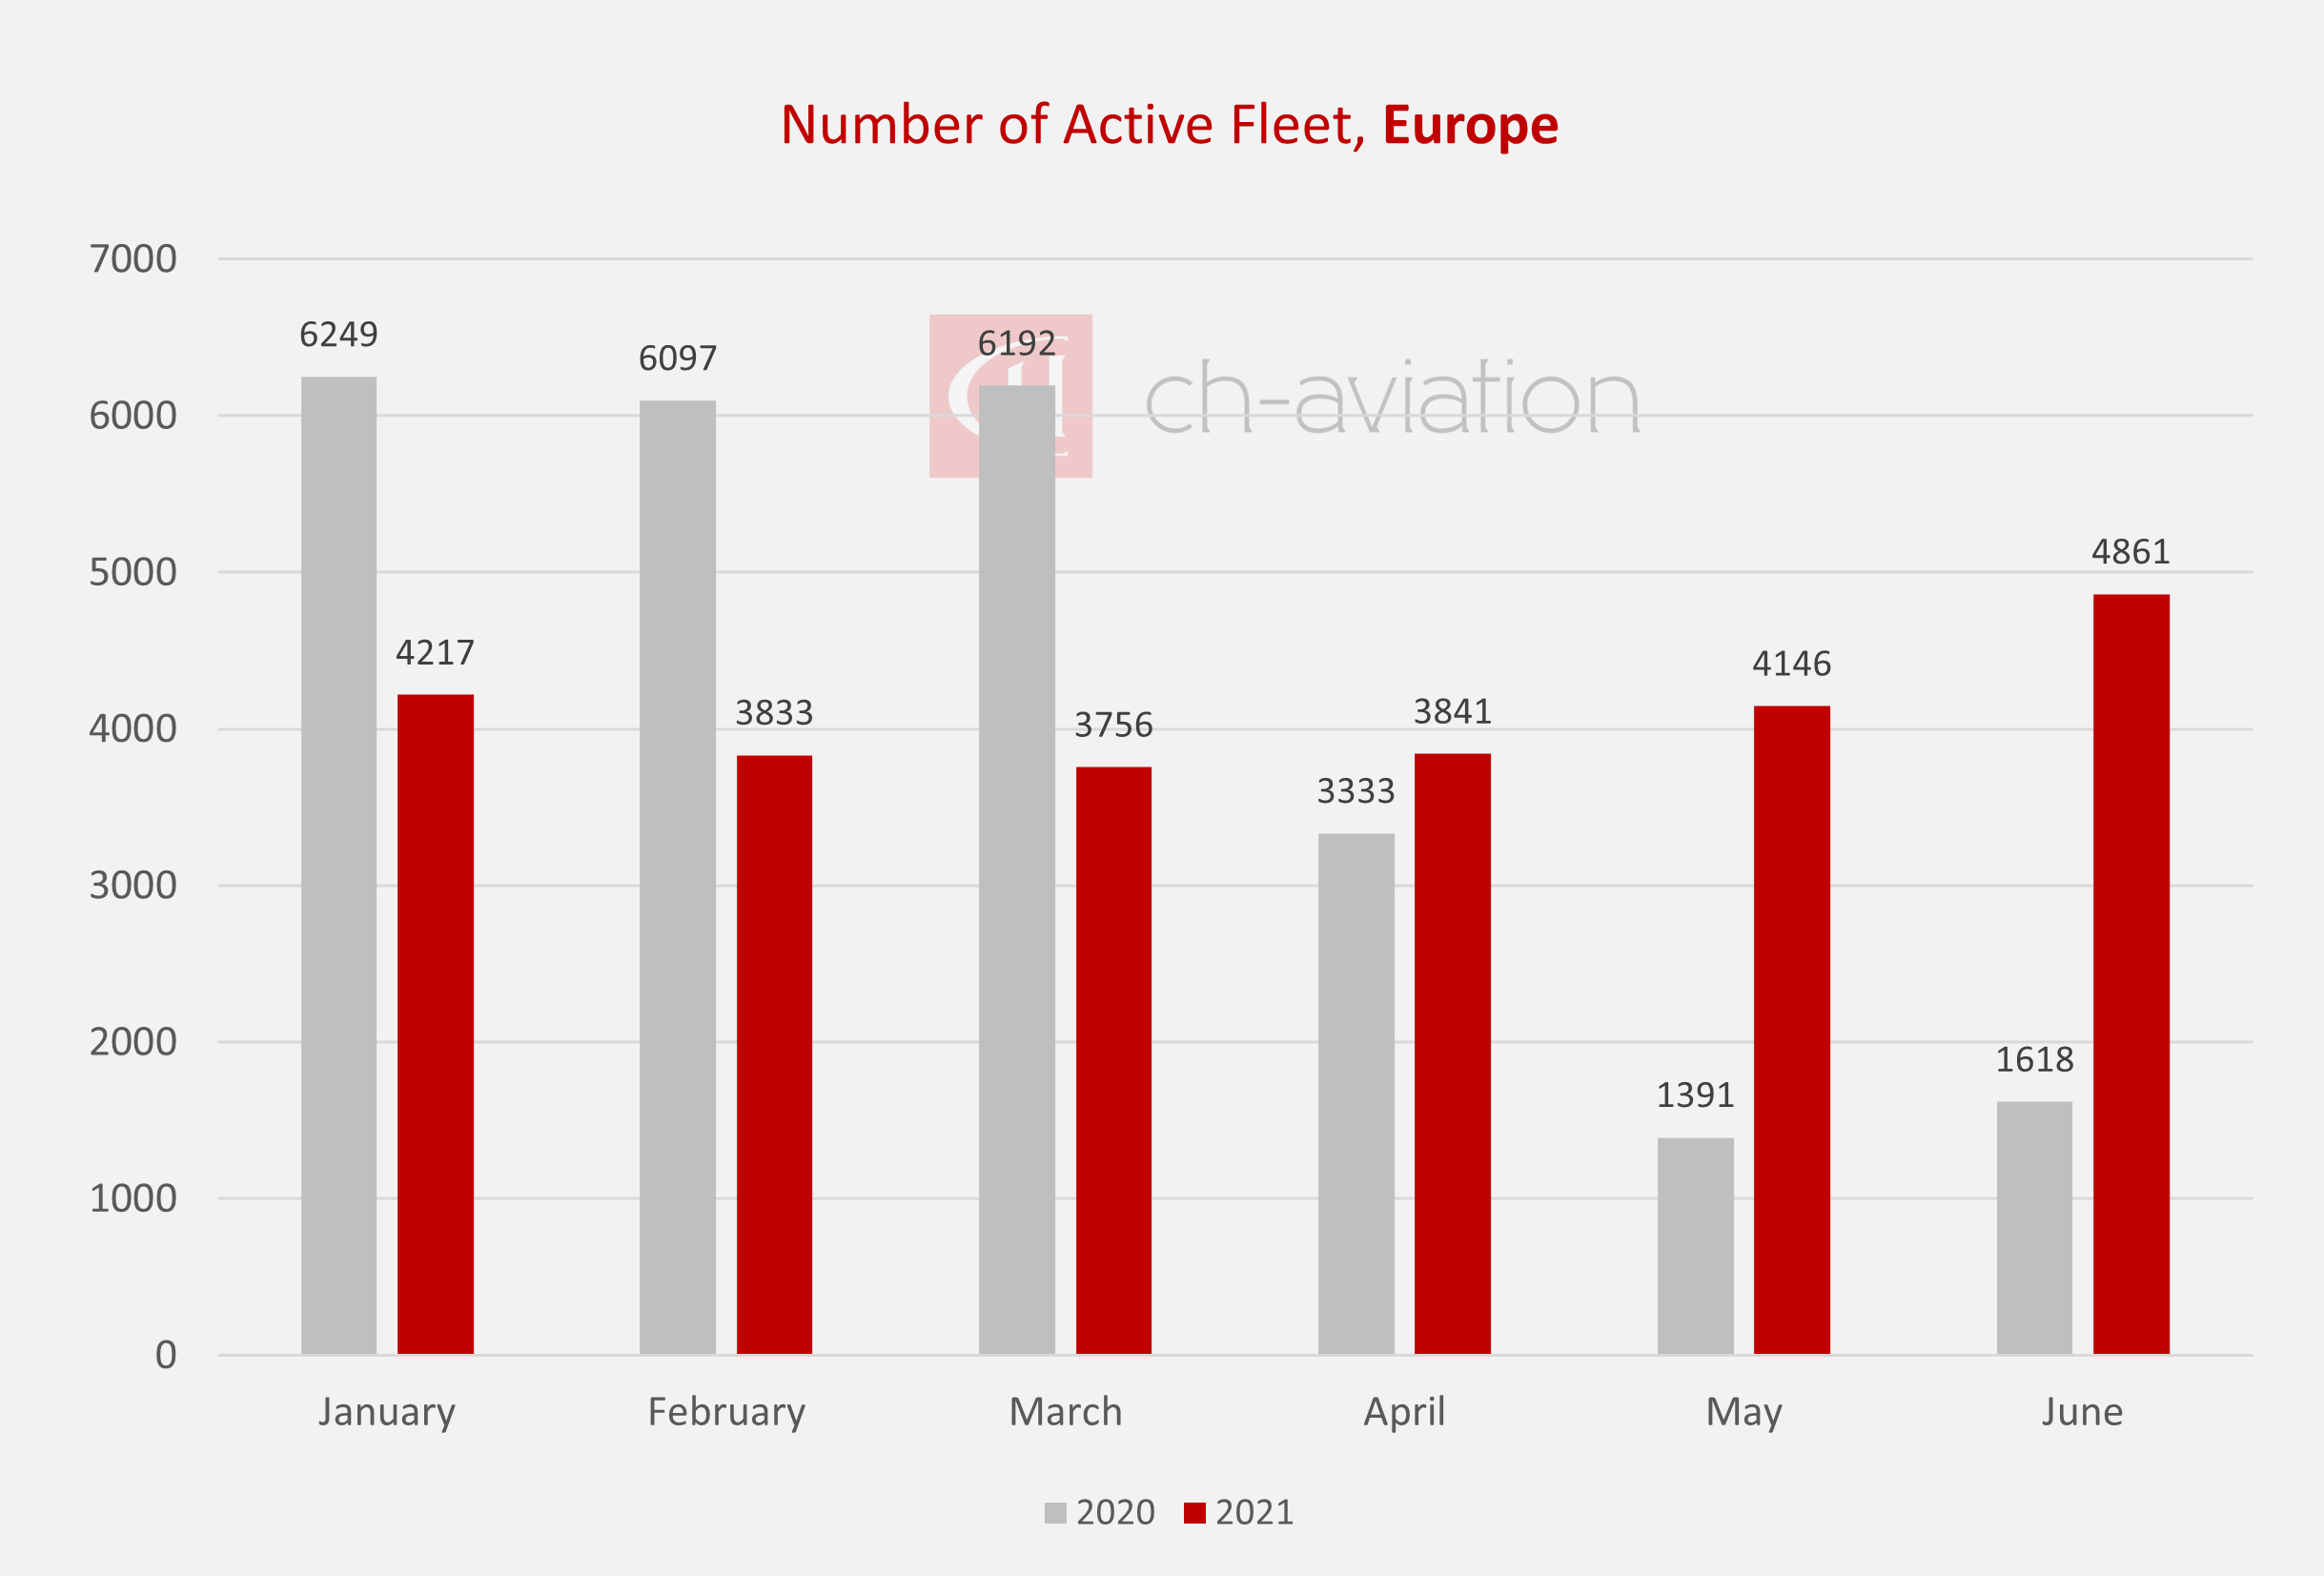
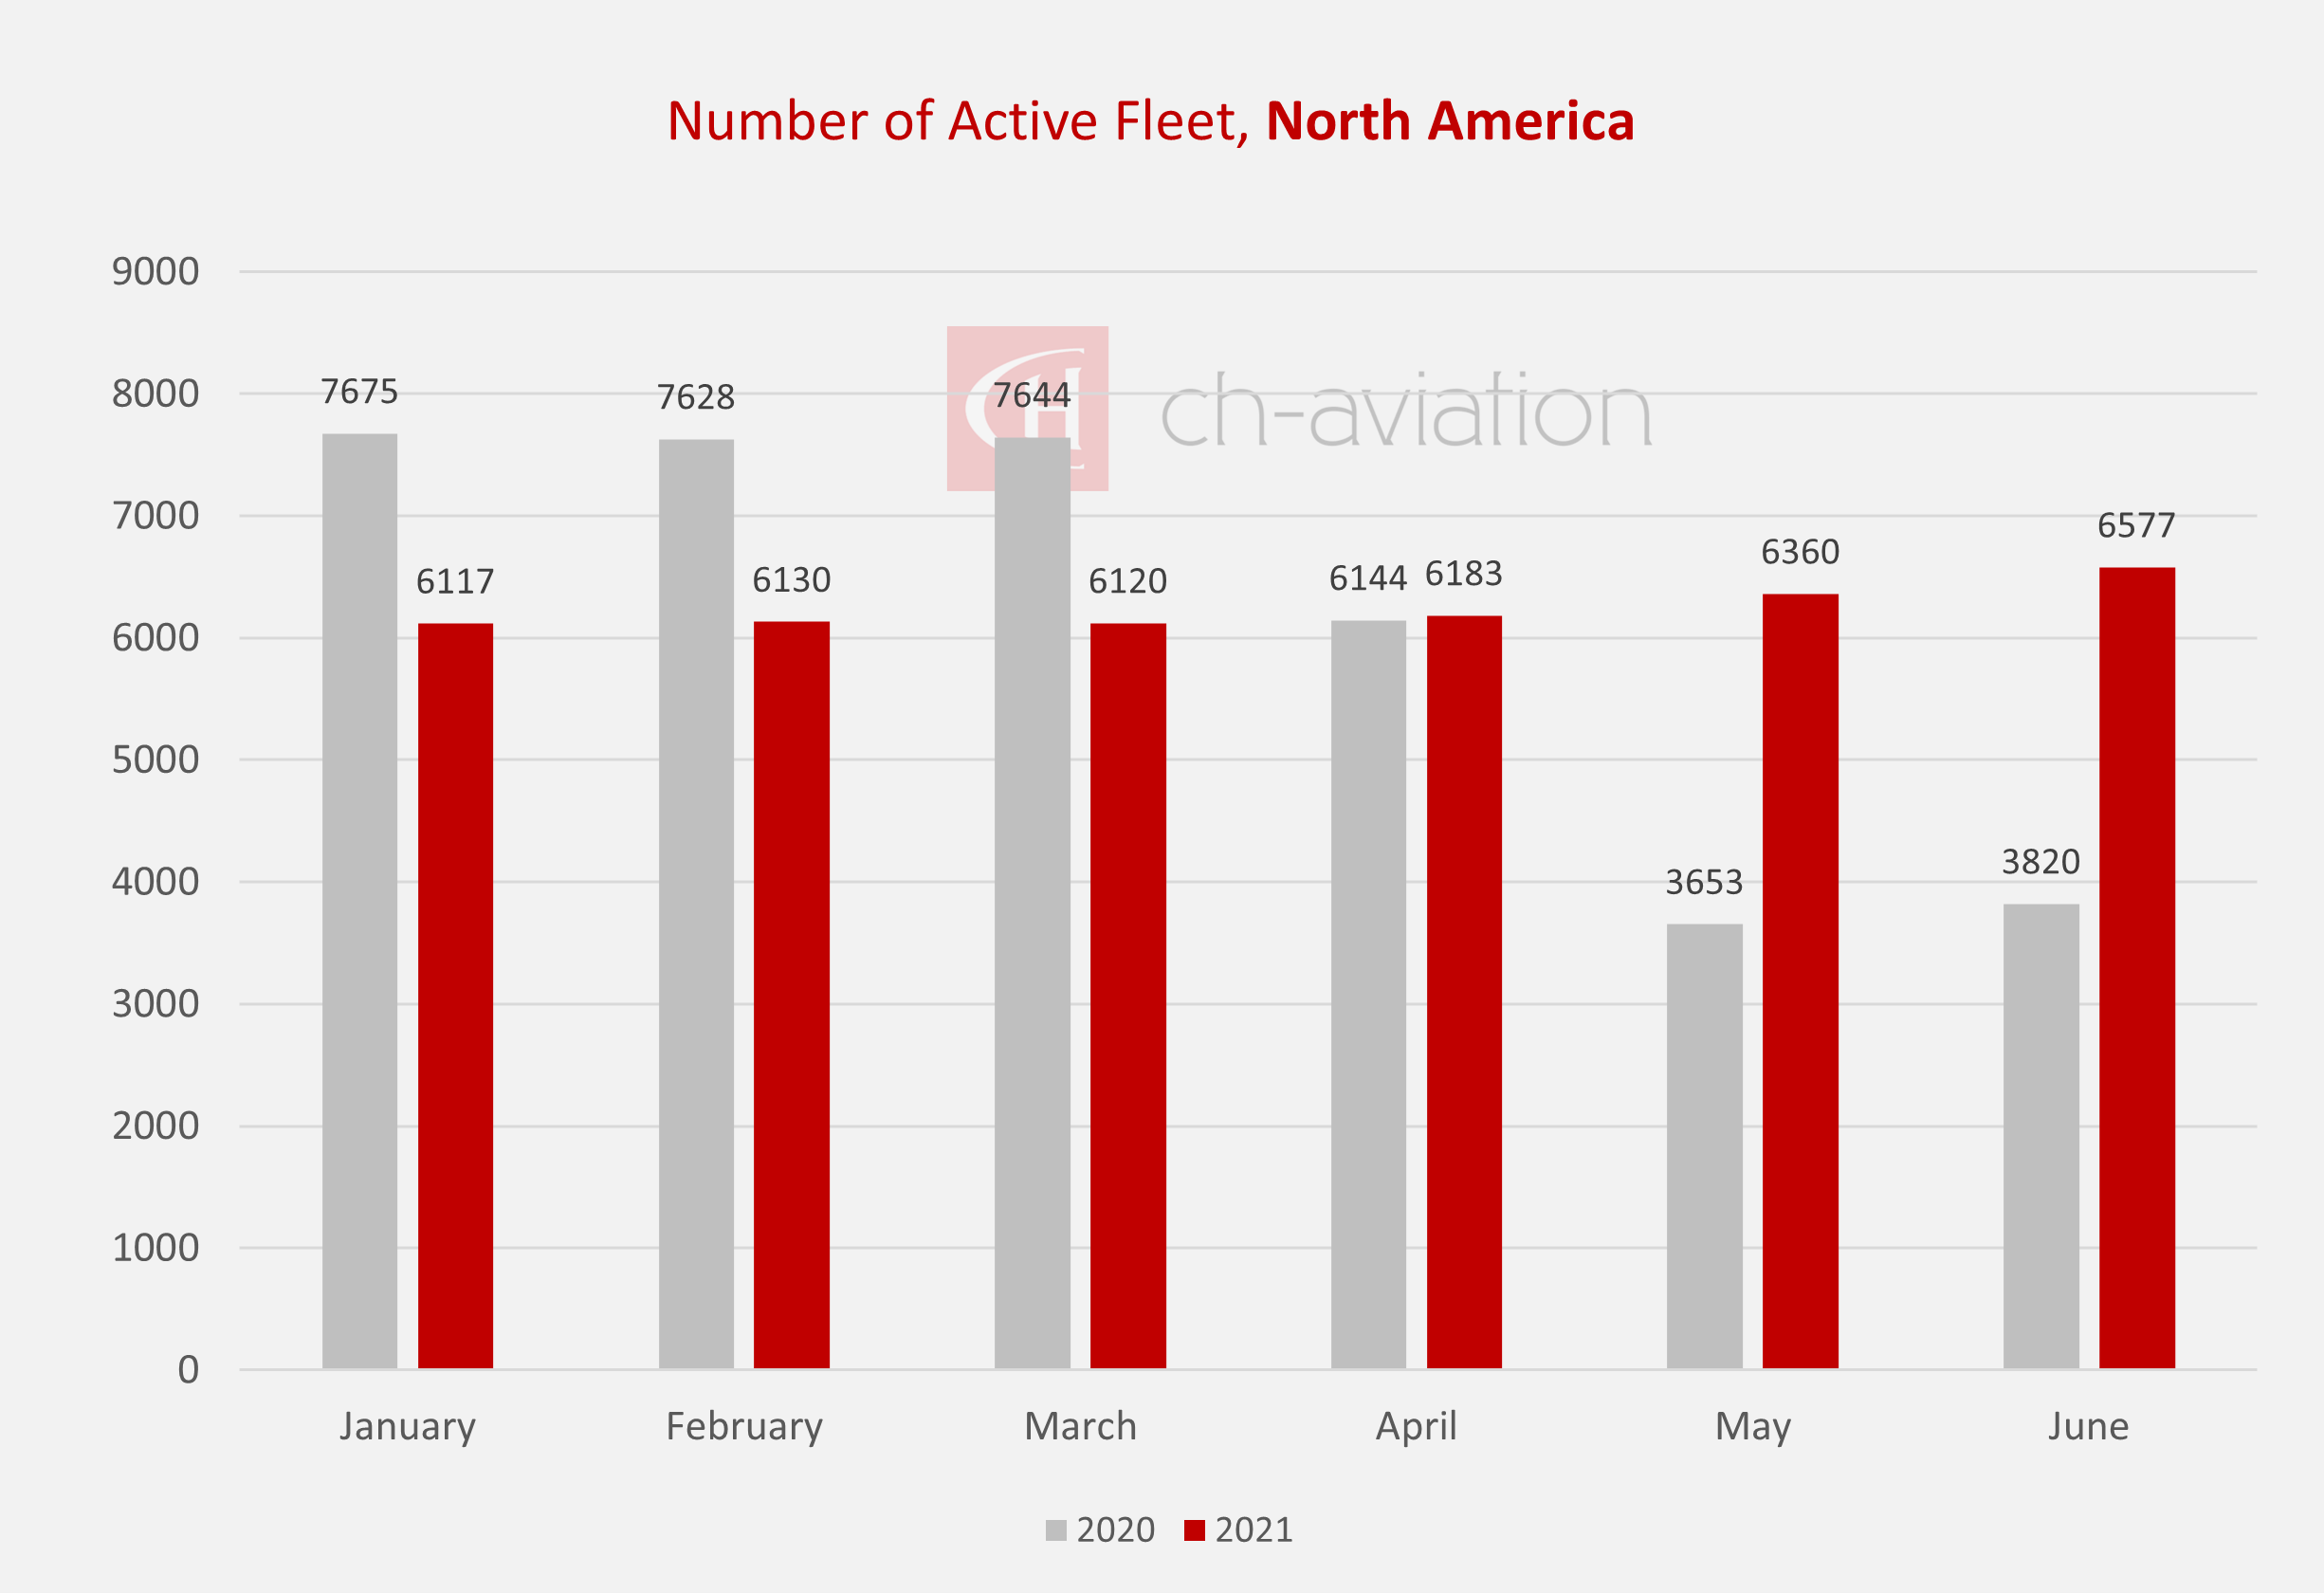
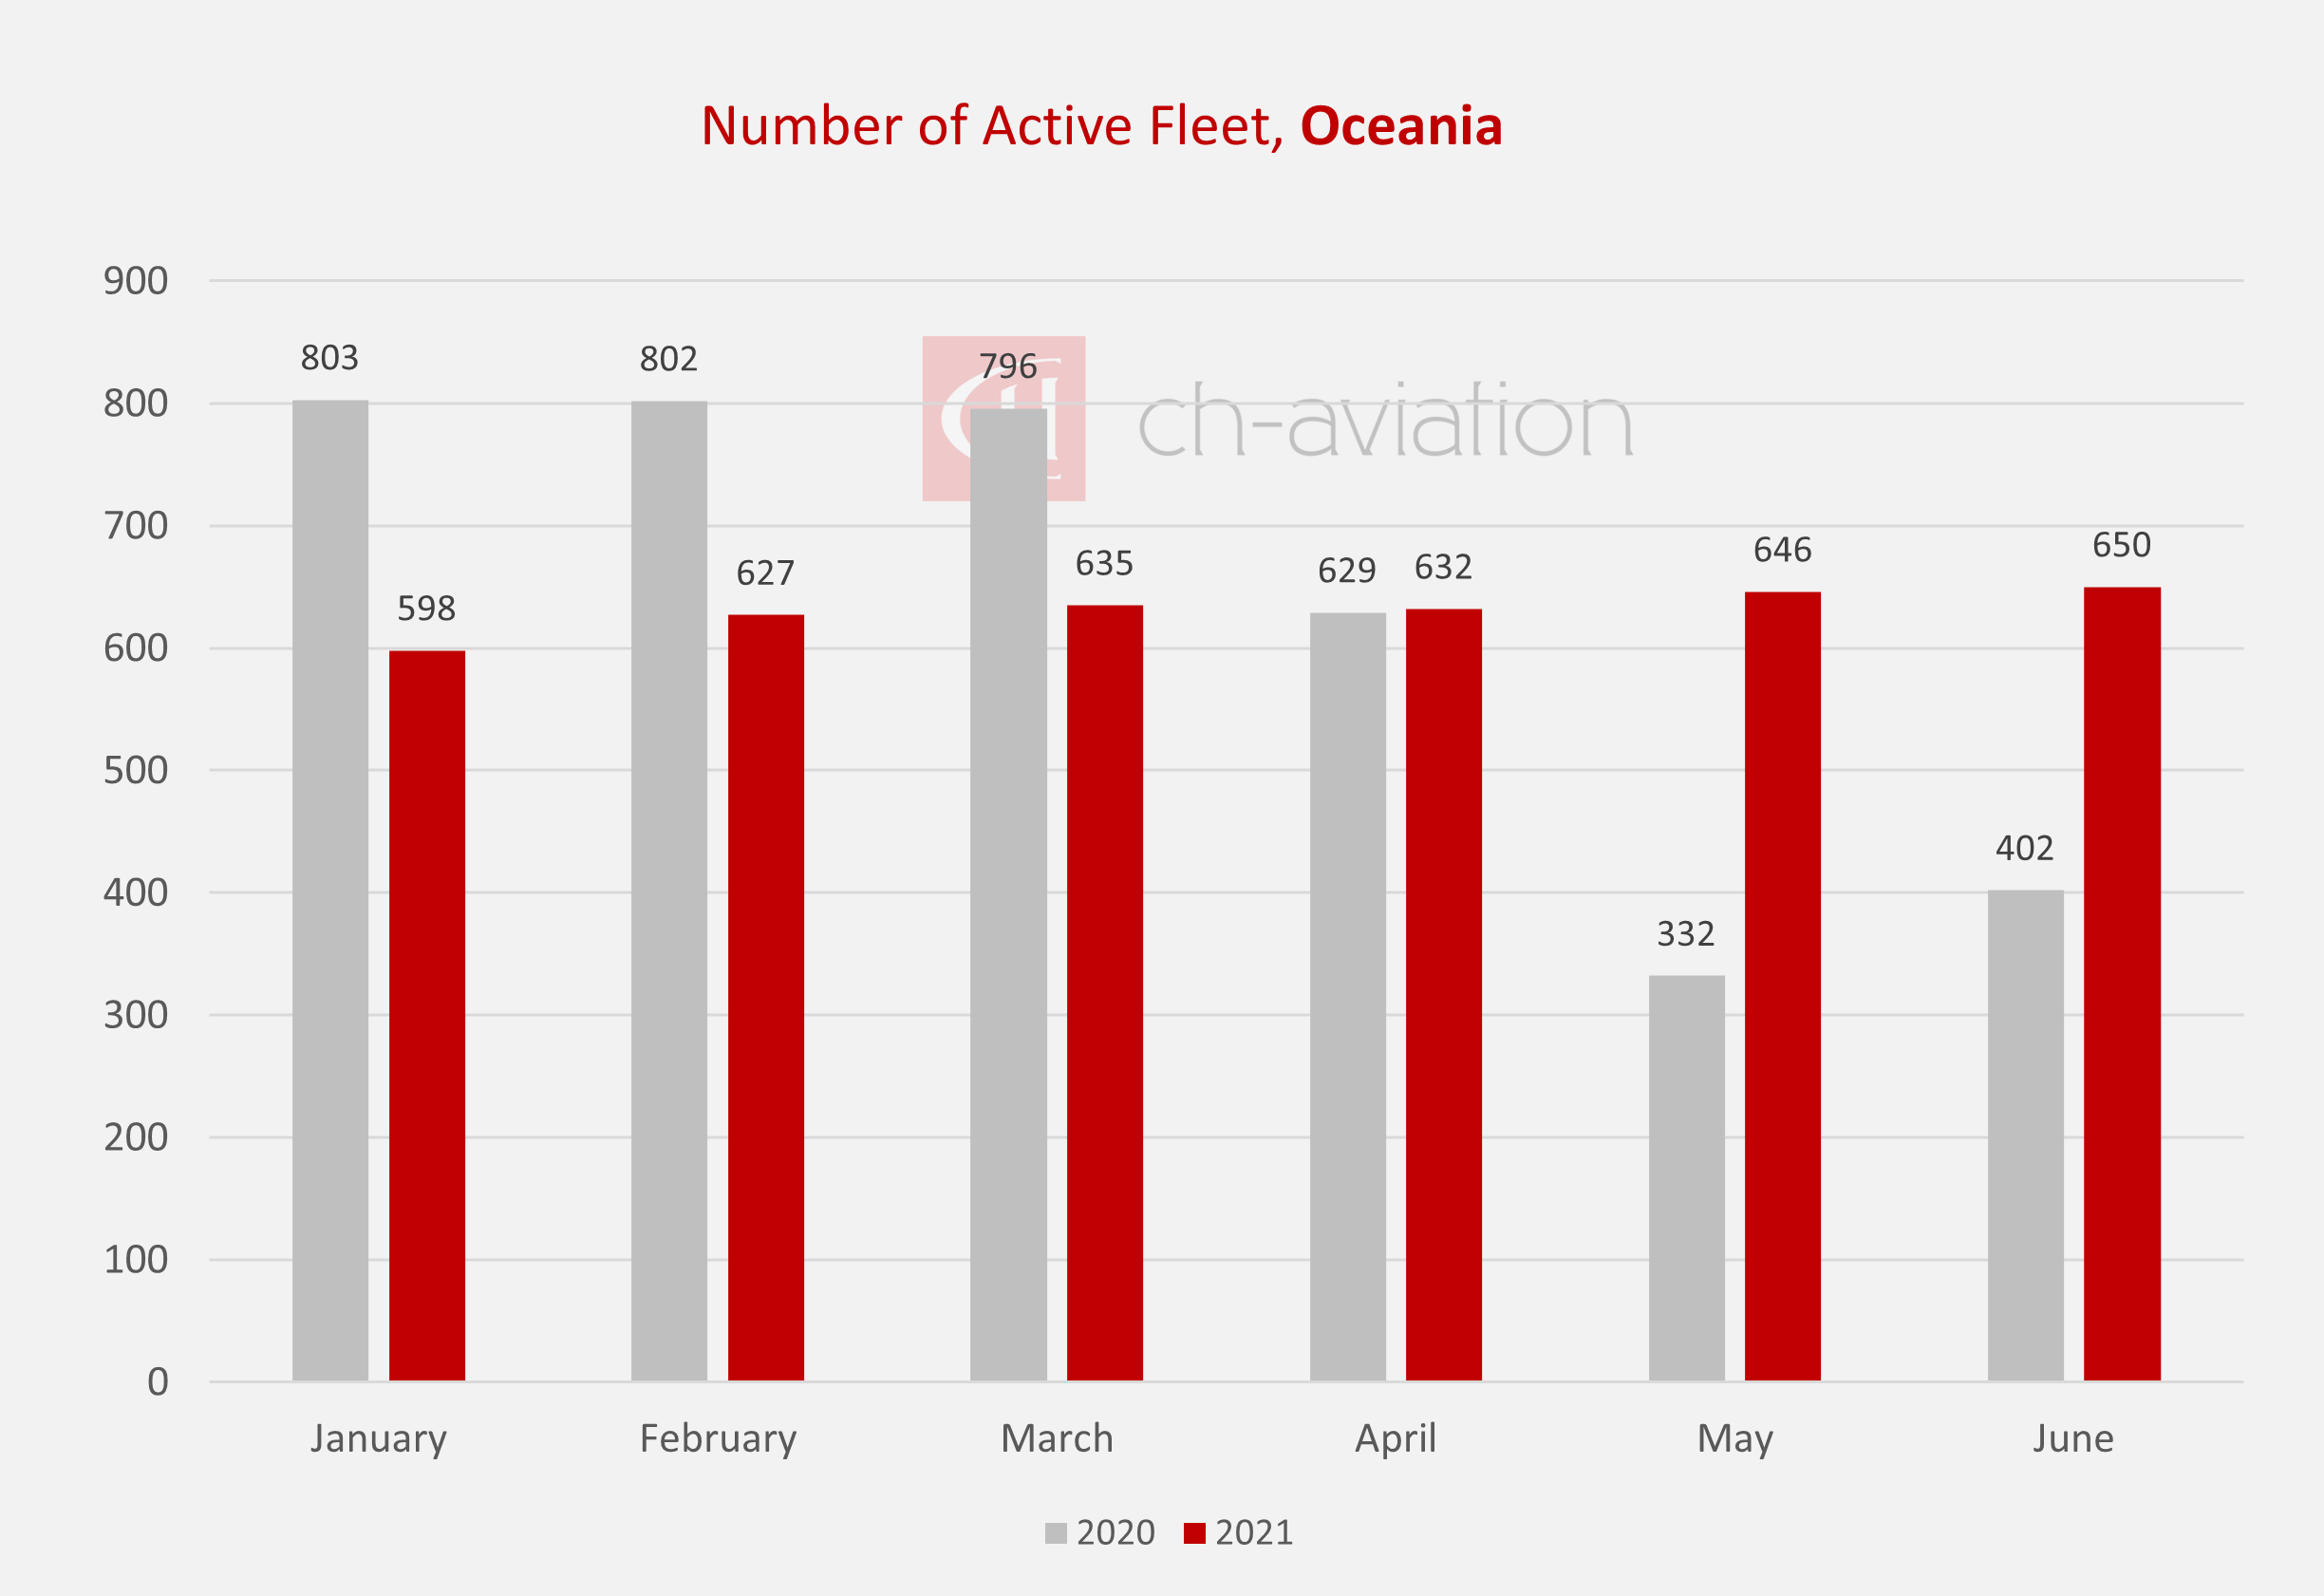
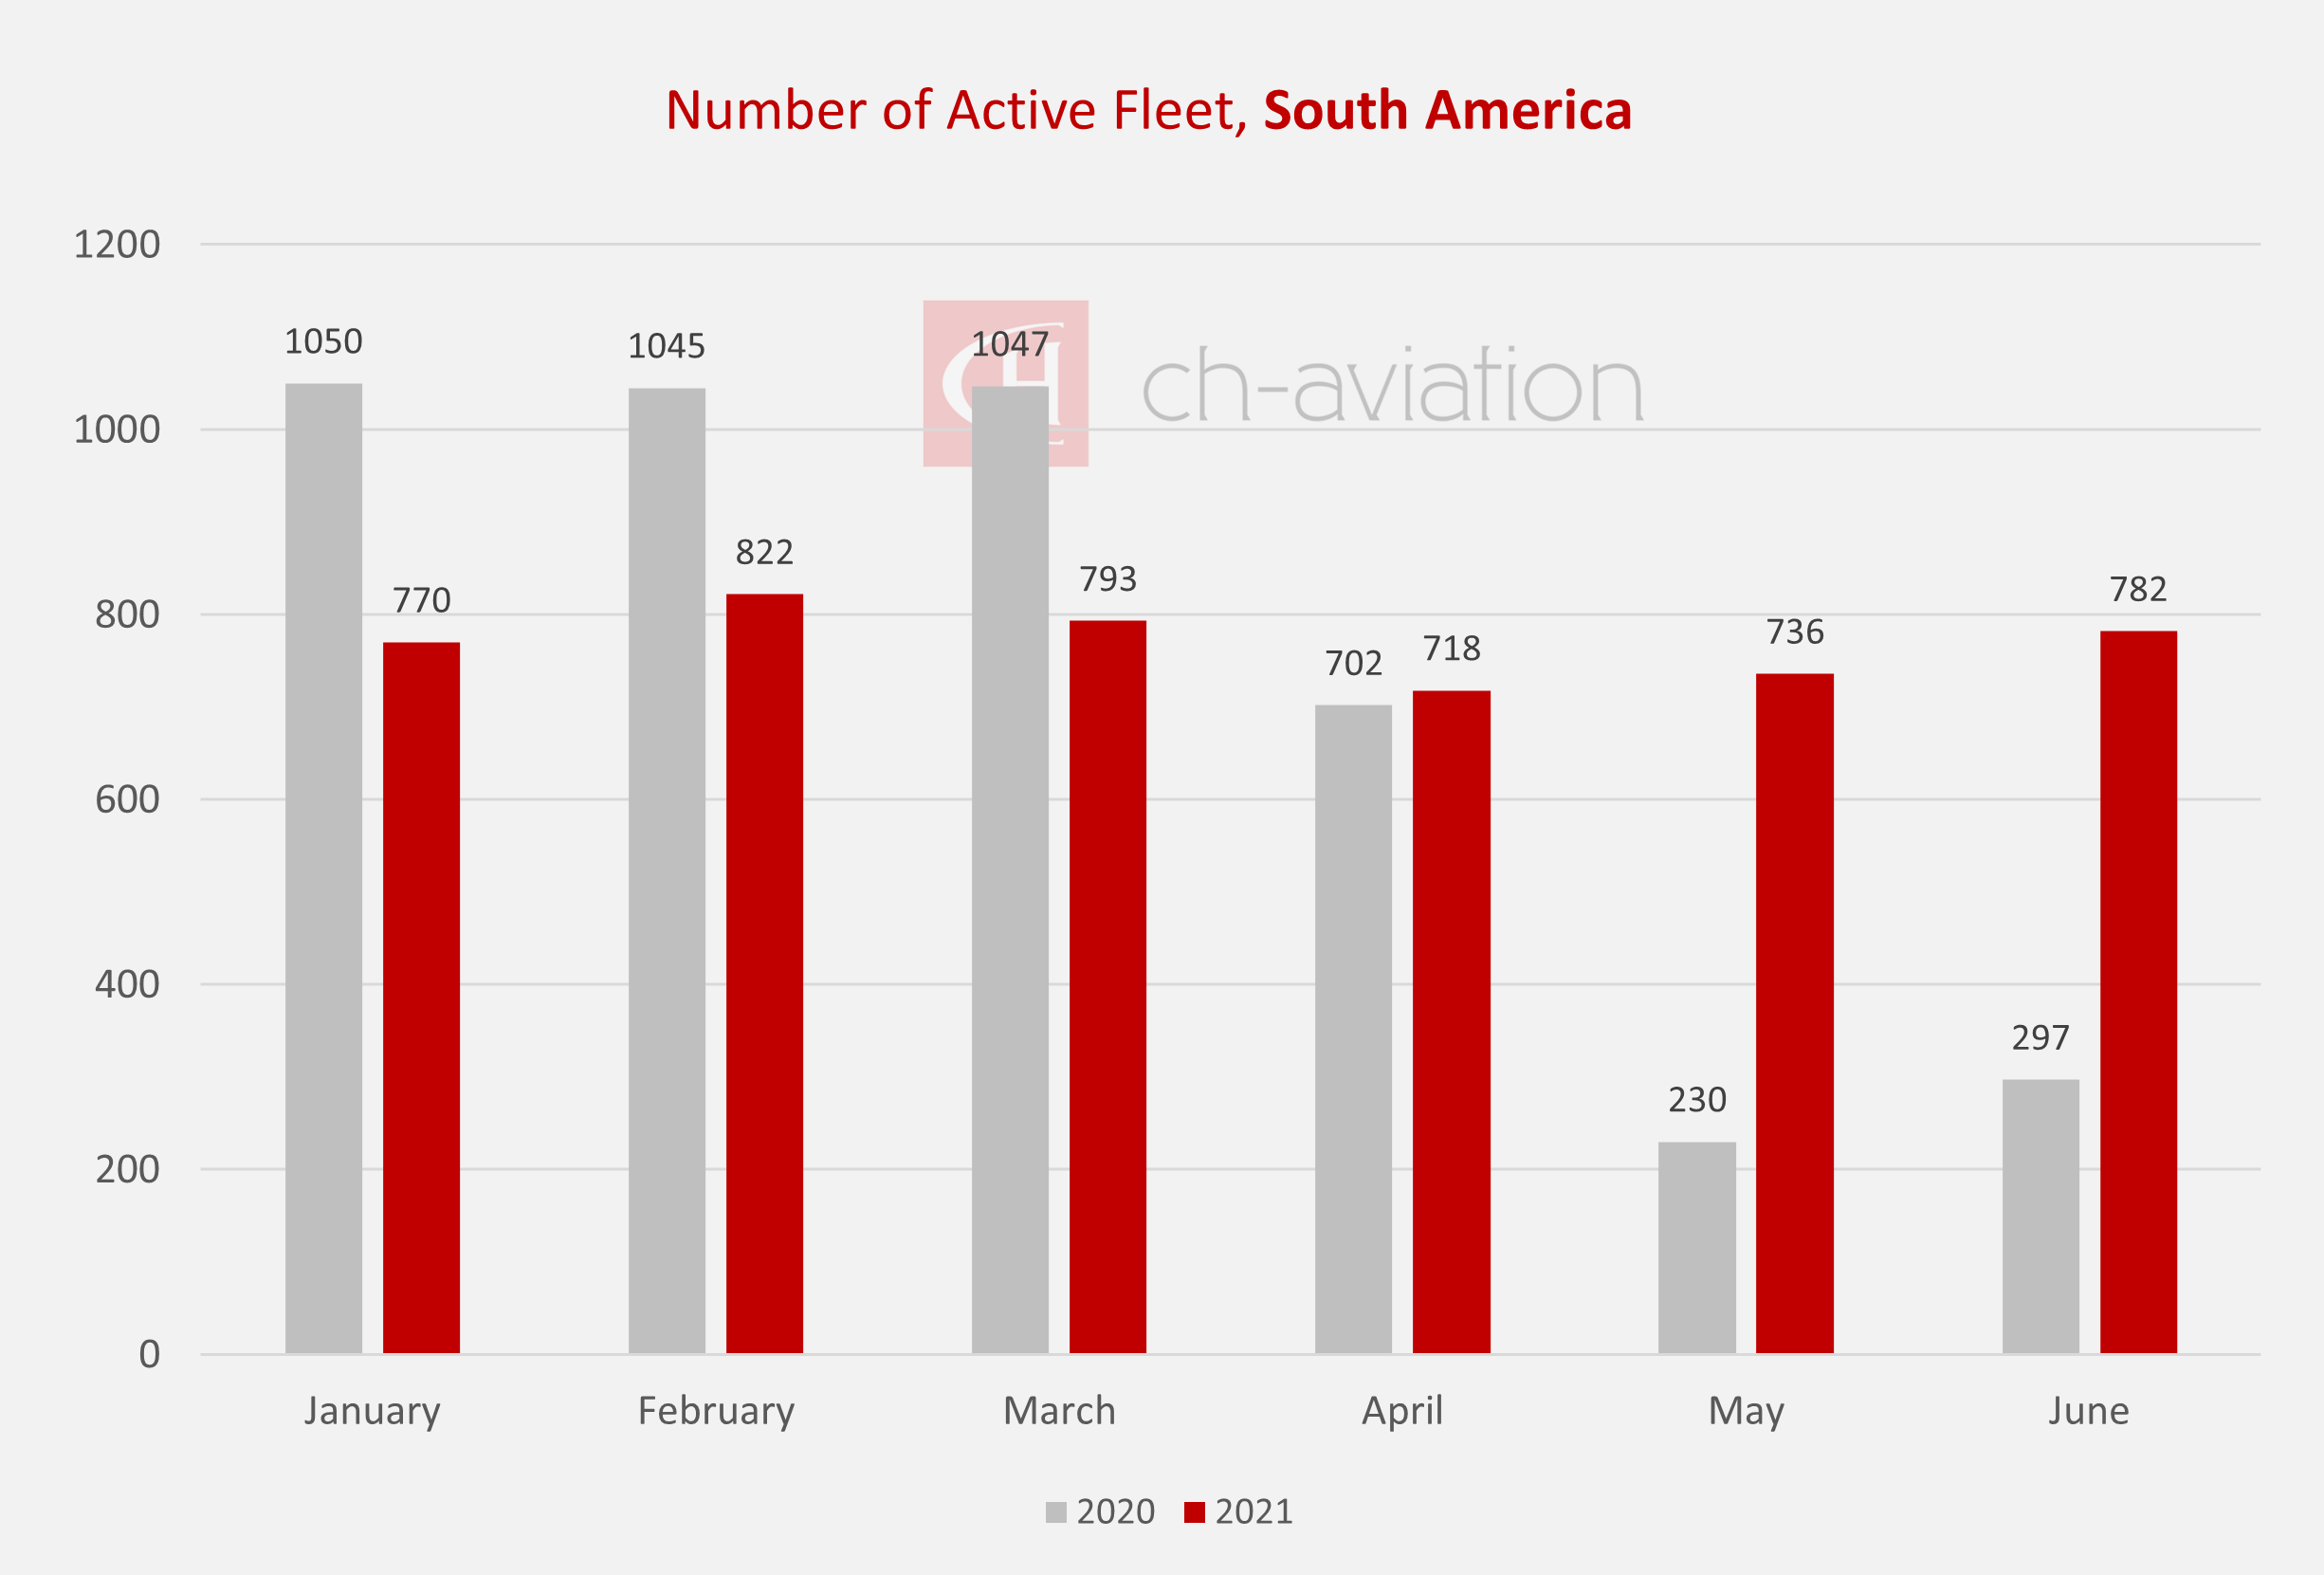
Asia and North America still lead the list of continents with the highest number of active aircraft. Asia counts 7,446, while North America counts 6,577 active aircraft. Europe is following with 4,861, while Africa counts 819, South America 782, and Oceania 650. Compared to the last month’s figures, all of them record a minor increase which forms a positive trend.
| Continent | active | grounded | total |
| Africa | 819 | 462 | 1281 |
| Asia | 7446 | 2555 | 10001 |
| Europe | 4861 | 1712 | 6573 |
| North America | 6577 | 1439 | 8016 |
| Oceania | 650 | 159 | 809 |
| South America | 782 | 328 | 1110 |
| Grand Total | 21135 | 6655 | 27790 |
Netherlands takes the lead in the TOP 10 countries with the highest percentage of active aircraft (with/more than 100 aircraft in their portfolio). Out of 221 aircraft, 214 are currently active. Among the Top 10 countries with the most active aircraft are China, Poland, Japan, Ethiopia, the Russian Federation, the United States of America, New Zealand, Hungary and Ireland.
| Country | active | grounded | total | % active |
| Netherlands (the) | 214 | 7 | 221 | 97% |
| China | 3453 | 368 | 3821 | 90% |
| Poland | 139 | 15 | 154 | 90% |
| Japan | 554 | 65 | 619 | 90% |
| Ethiopia | 96 | 13 | 109 | 88% |
| Russian Federation (the) | 847 | 130 | 977 | 87% |
| United States of America (the) | 5661 | 888 | 6549 | 86% |
| New Zealand | 99 | 17 | 116 | 85% |
| Hungary | 107 | 21 | 128 | 84% |
| Ireland | 297 | 59 | 356 | 83% |
Hong Kong leads the Top 10 countries with the highest amount of grounded aircraft. Out of 232 Hong Kong registered aircraft, a total of 154 aircraft are still parked. Among the Top 10 countries with the most inactive aircraft are Malaysia, Thailand, Nigeria, Viet Nam, the United Kingdom, the Philippines, Iran, Canada and South Africa.
| Country | active | grounded | total | % grounded |
| Hong Kong | 78 | 154 | 232 | 66% |
| Malaysia | 95 | 164 | 259 | 63% |
| Thailand | 102 | 175 | 277 | 63% |
| Nigeria | 43 | 69 | 112 | 62% |
| Viet Nam | 98 | 131 | 229 | 57% |
| United Kingdom of Great Britain and Northern Ireland (the) | 351 | 410 | 761 | 54% |
| Philippines (the) | 107 | 114 | 221 | 52% |
| Iran (Islamic Republic of) | 126 | 126 | 252 | 50% |
| Canada | 455 | 393 | 848 | 46% |
| South Africa | 108 | 87 | 195 | 45% |
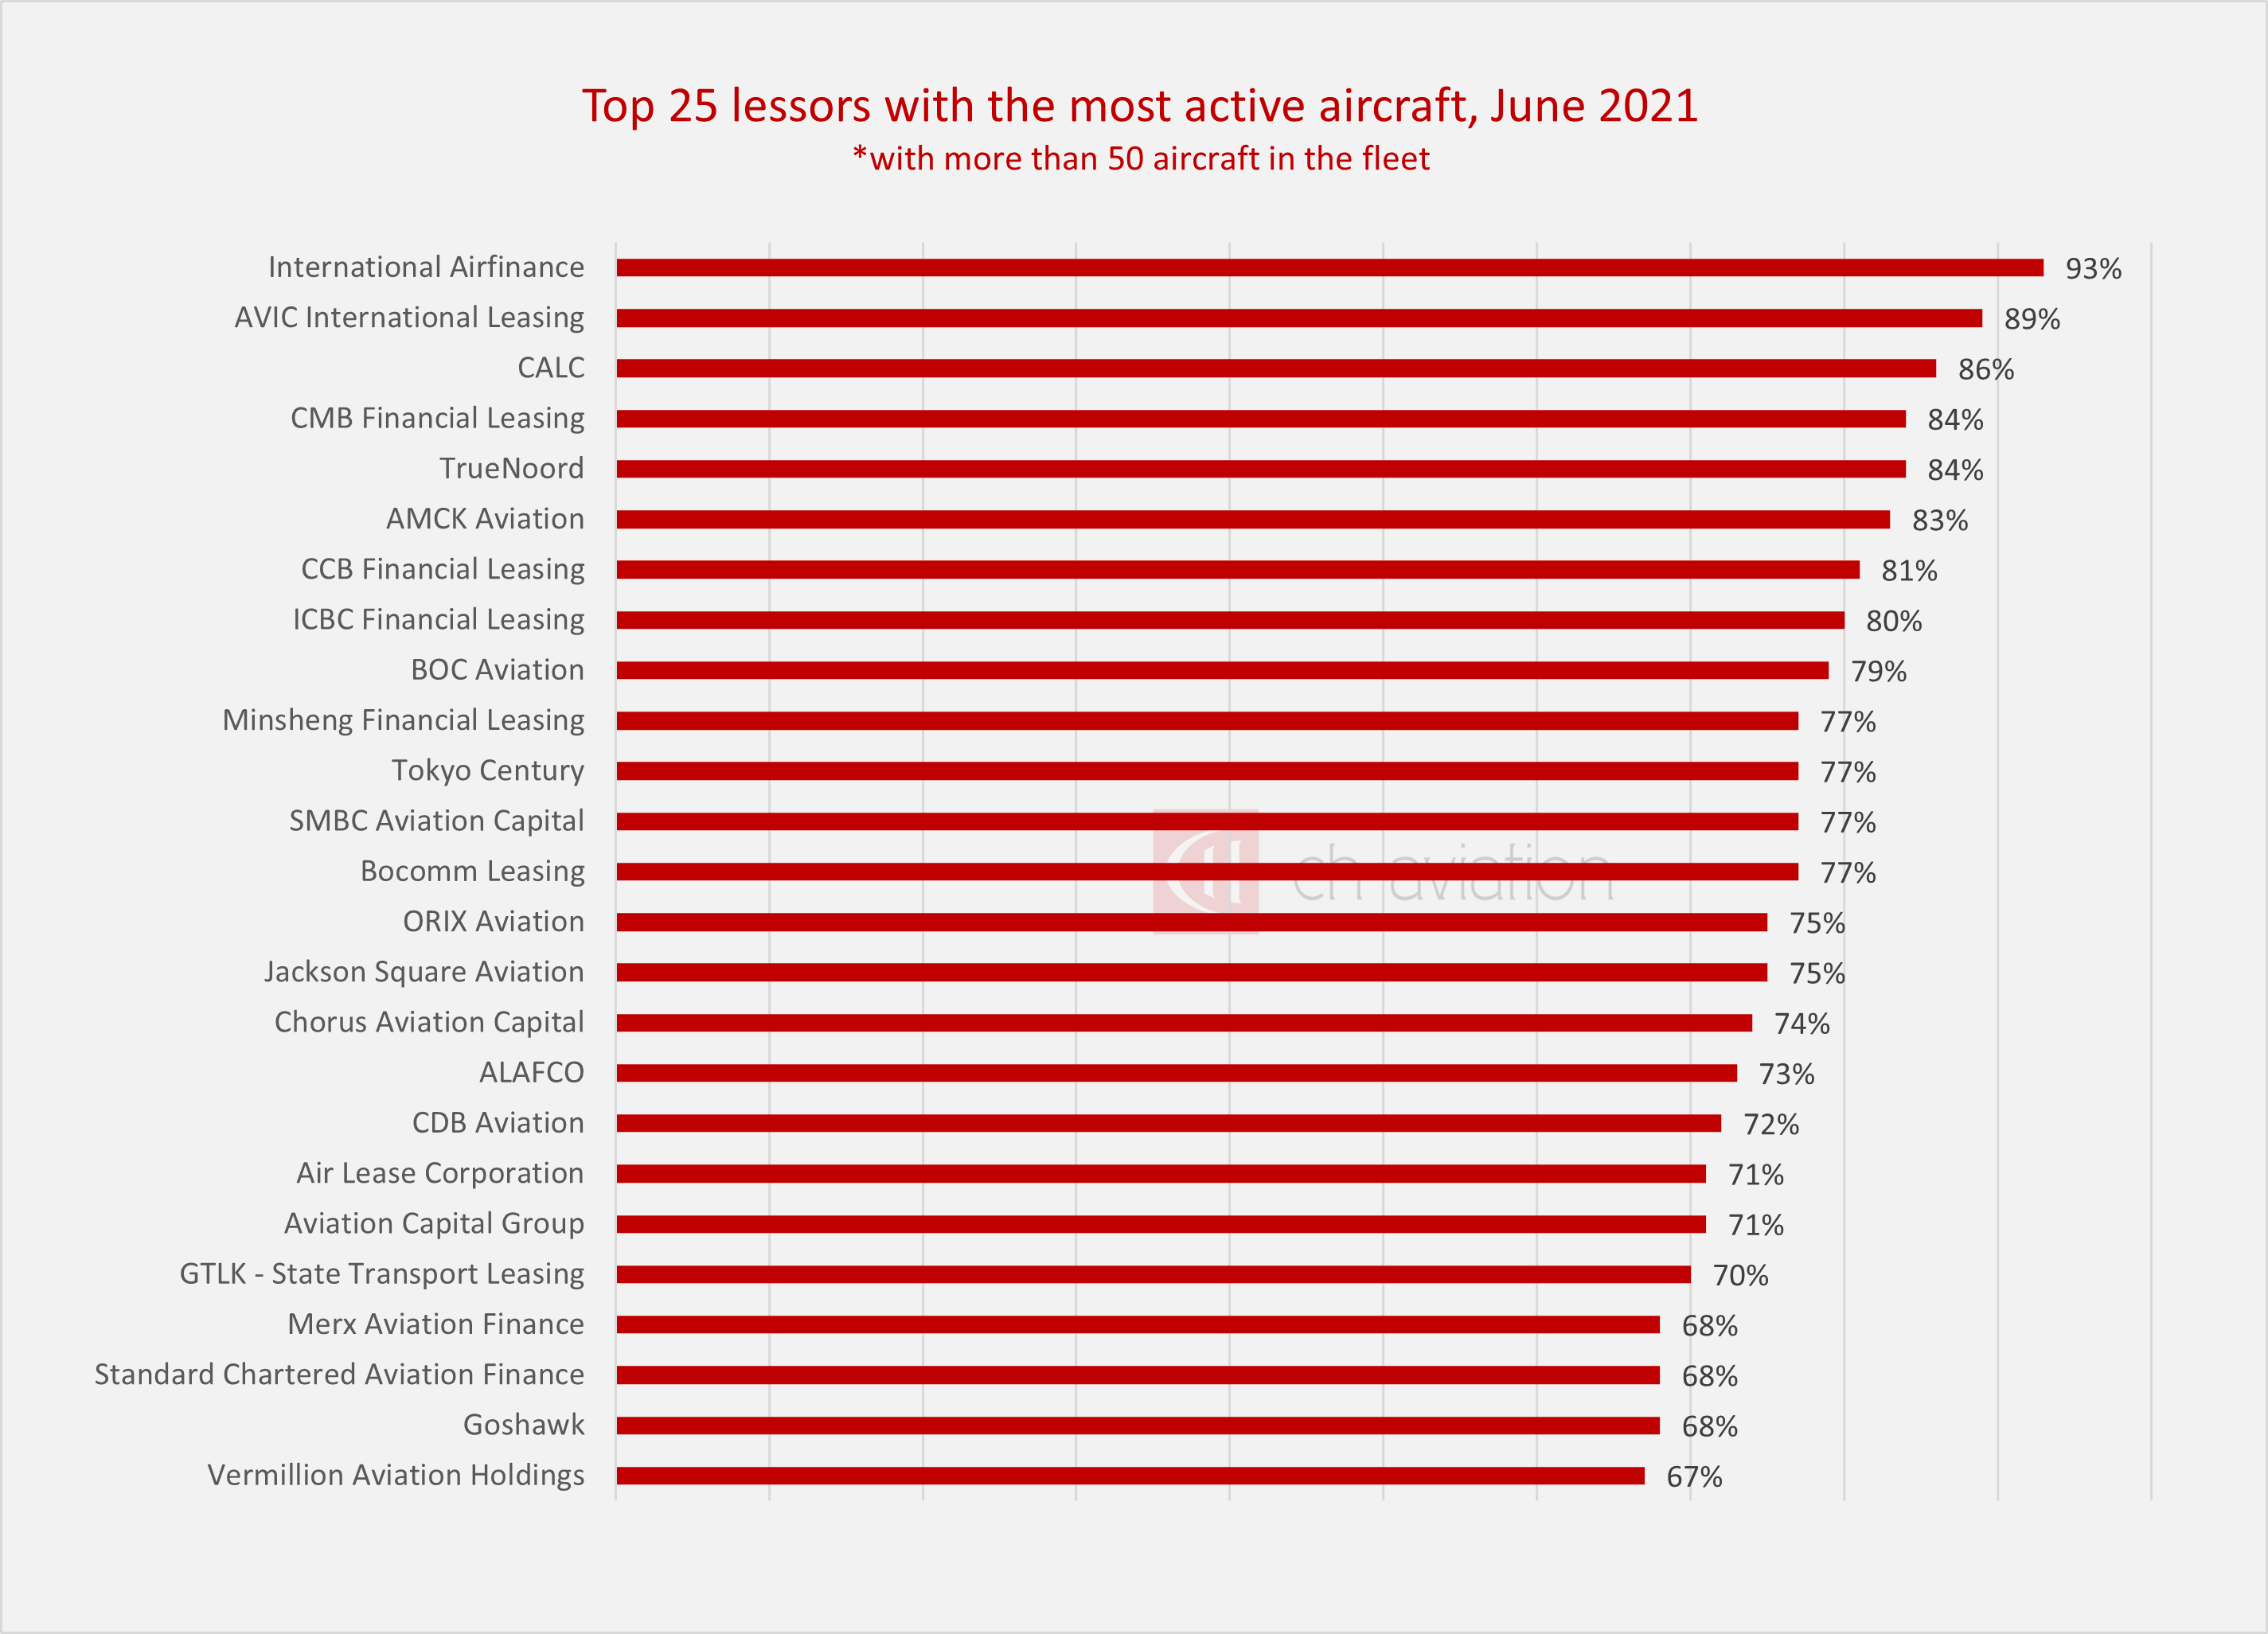
If we look at the Aircraft Lessors with more than 50 aircraft in their portfolio, the following 25 have the highest percentage of active aircraft:
We have used ch-aviation fleets advanced and fleets ownership data for this analysis. To get full and detailed insights on active and inactive aircraft, visit the following LINK.