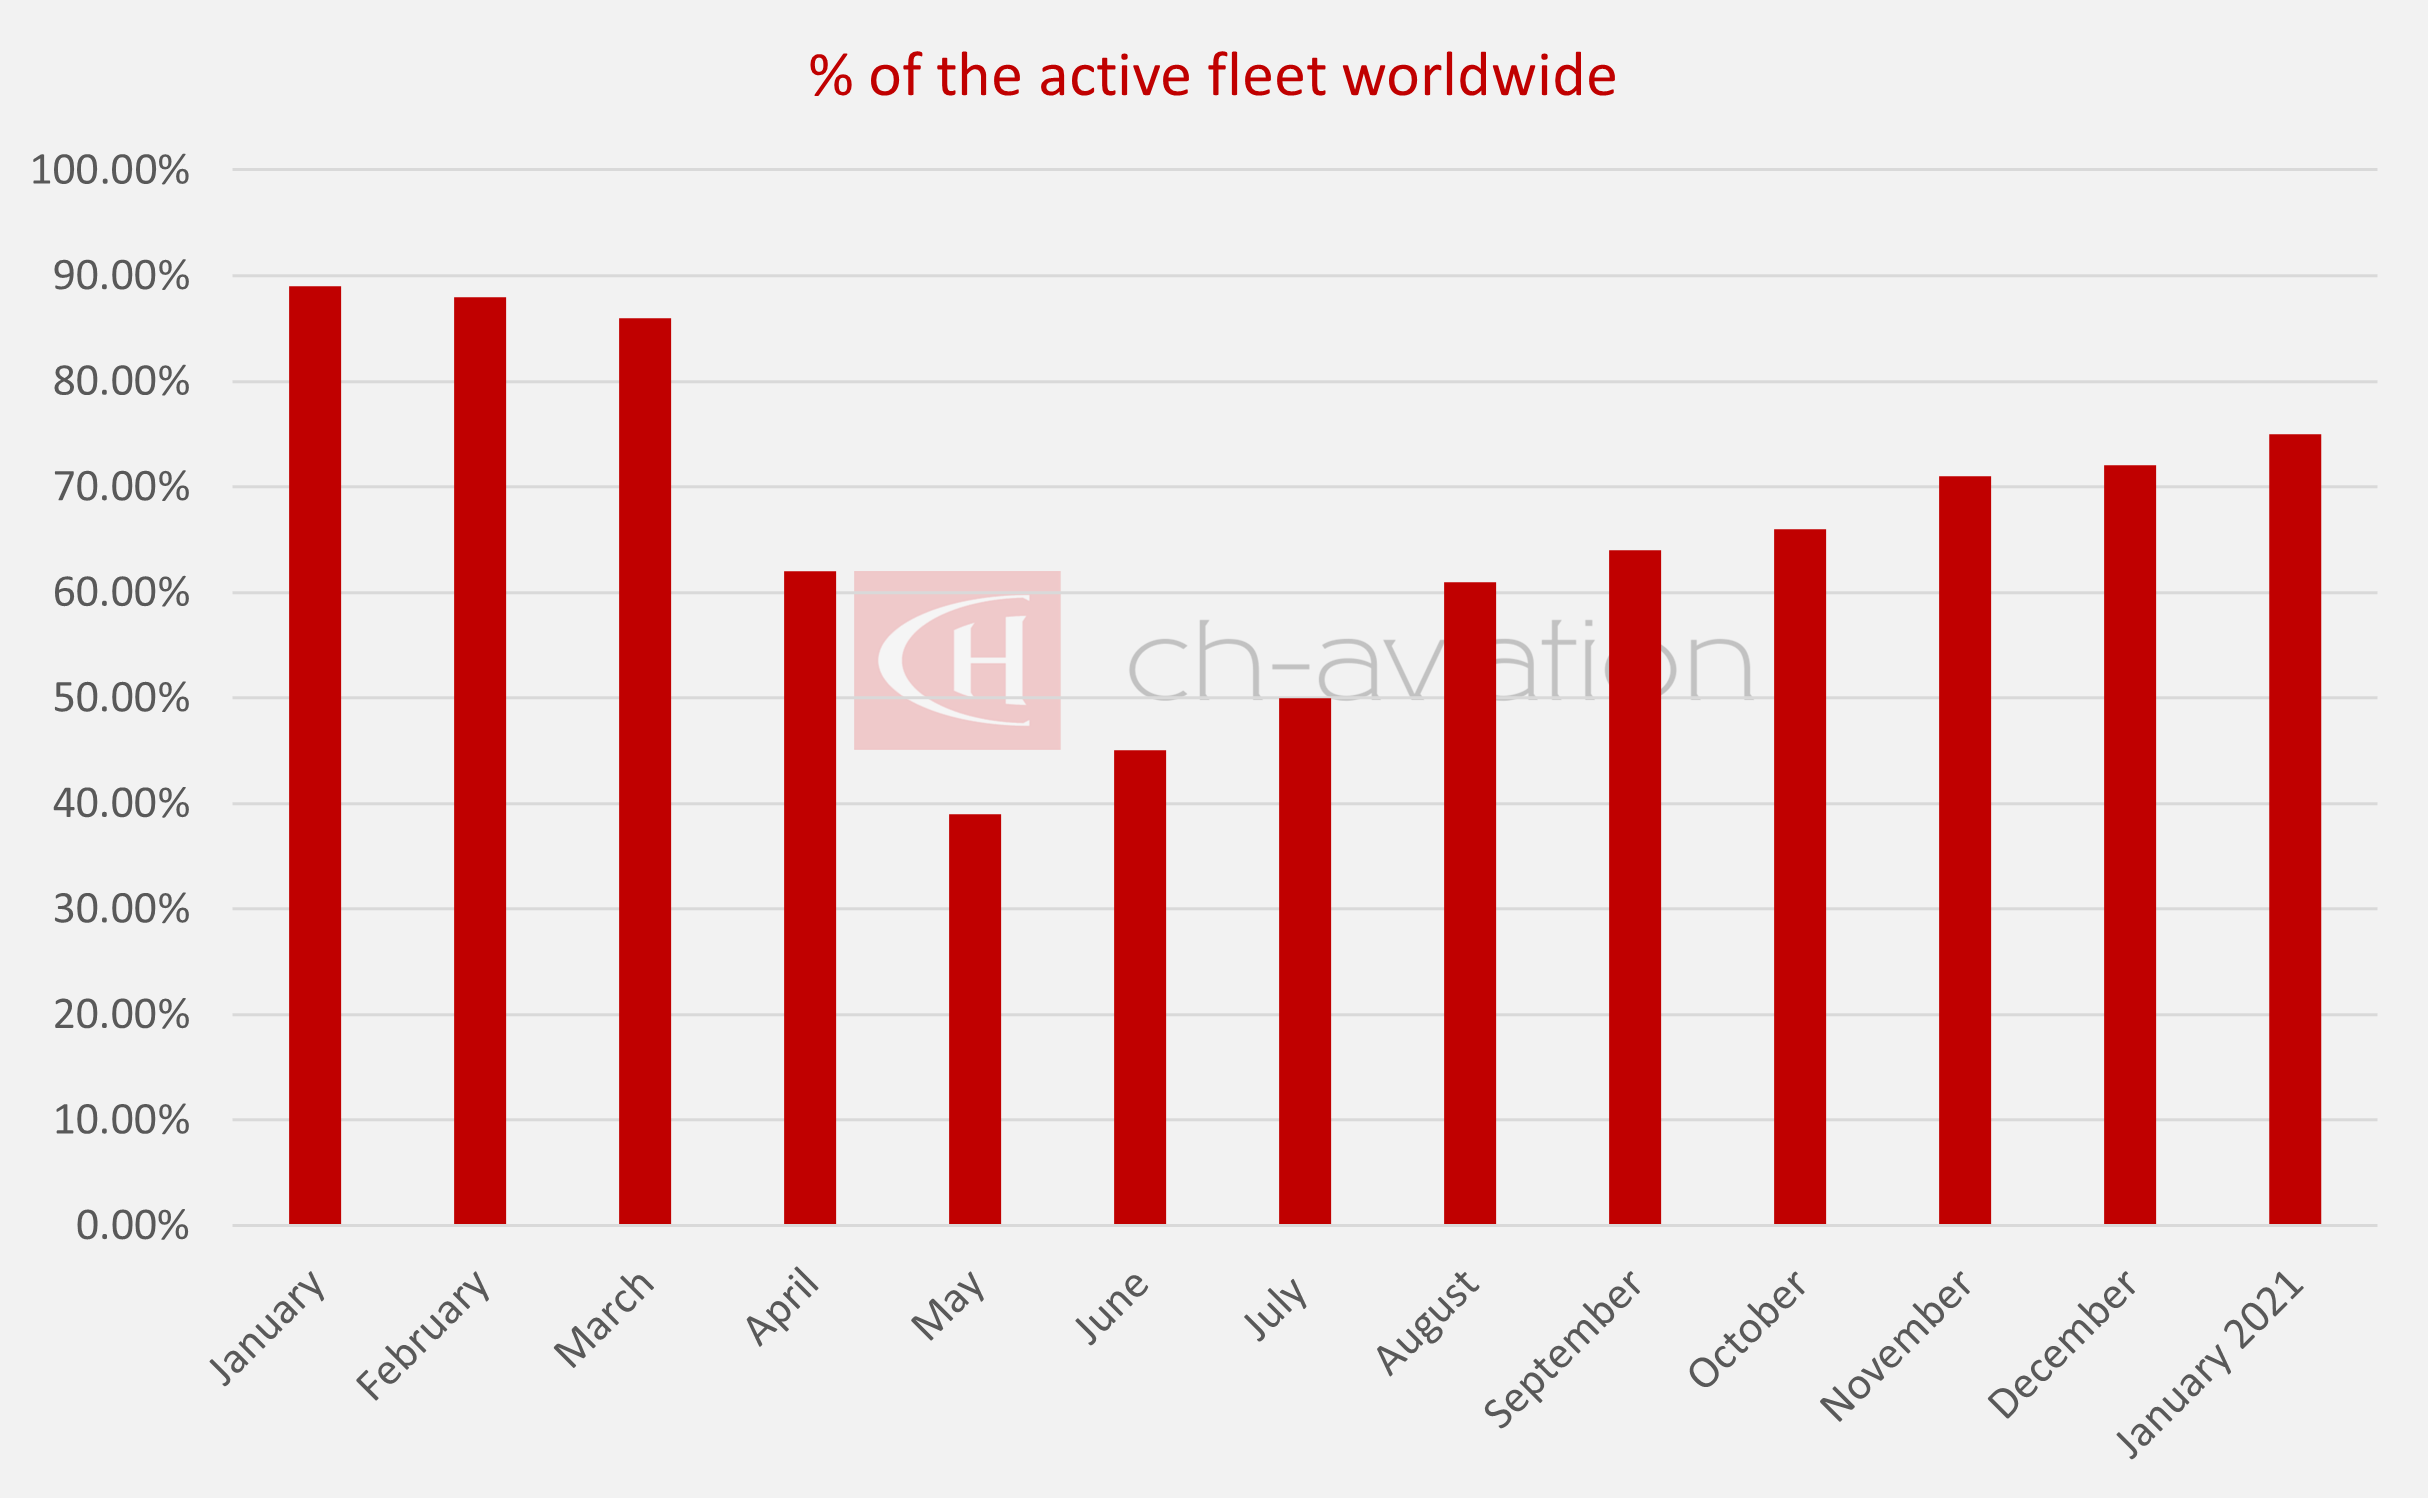
From August 2020 until today, we can notice a positive trend in growing numbers, with more and more aircraft coming back out of temporary storage. At the beginning of January, we’re counting 7.345 aircraft still grounded and 75% of the global fleet as active.
North America (80%) and Asia (78%) are still leading with the highest percentage of active fleets. They are followed by Oceania and South America, with 77% (Oceania) and 73% (South America). Due to many restrictions and lockdowns, Europe counts only 66% of its fleet active.
| Continents | Active | Grounded | Total | % active |
| Africa | 772 | 484 | 1256 | 65.18% |
| Asia | 7652 | 2229 | 9881 | 77.89% |
| Europe | 4217 | 2386 | 6603 | 66.35% |
| North America | 6117 | 1713 | 7830 | 79.61% |
| Oceania | 598 | 197 | 795 | 77.41% |
| South America | 770 | 336 | 1106 | 72.97% |
| TOTAL | 20126 | 7345 | 27471 | 74.74% |
We understand grounded fleets do not fully represent airline activity as airlines inevitably have different utilization levels for specific aircraft.
When it comes to the TOP 10 countries with the highest percentage of active fleets, counting more than 100 registered aircraft, Japan leads with 93% of the active fleet with 614 aircraft. The list is followed by China, Ethiopia, Taiwan, Netherlands, Mexico, Viet Nam, Brazil, India, New Zealand.
| Country | Active | Grounded | Total | % active |
| Japan | 614 | 46 | 660 | 93.03% |
| China | 3481 | 271 | 3752 | 92.78% |
| Ethiopia | 98 | 13 | 111 | 88.29% |
| Taiwan (Province of China) | 175 | 26 | 201 | 87.06% |
| Netherlands (the) | 186 | 31 | 217 | 85.71% |
| Mexico | 269 | 45 | 314 | 85.67% |
| Viet Nam | 179 | 35 | 214 | 83.64% |
| Brazil | 391 | 77 | 468 | 83.55% |
| India | 582 | 121 | 703 | 82.79% |
| New Zealand | 97 | 21 | 118 | 82.20% |
Nigeria still leads the TOP10 countries’ list with the highest percentage of grounded fleets by airline and counting more than 100 registered aircraft, with 69% of its fleet grounded. Nigeria is followed by Hong Kong, Argentina, Singapore, Iran, Malaysia, Philippines, Germany, the United Kingdom, and Italy.
| Country | Active | Grounded | Total | % grounded |
| Nigeria | 32 | 72 | 104 | 69.23% |
| Hong Kong | 75 | 147 | 222 | 66.22% |
| Argentina | 45 | 60 | 105 | 57.14% |
| Singapore | 93 | 124 | 217 | 57.14% |
| Iran (Islamic Republic of) | 104 | 137 | 241 | 56.85% |
| Malaysia | 118 | 140 | 258 | 54.26% |
| Philippines (the) | 103 | 116 | 219 | 52.97% |
| Germany | 259 | 272 | 531 | 51.22% |
| United Kingdom | 378 | 372 | 750 | 49.60% |
| Italy | 73 | 70 | 143 | 48.95% |
Another updated analysis is available on the Top 25 lessors (counting more than 50 aircraft in their fleet), with the most active aircraft in their portfolio.
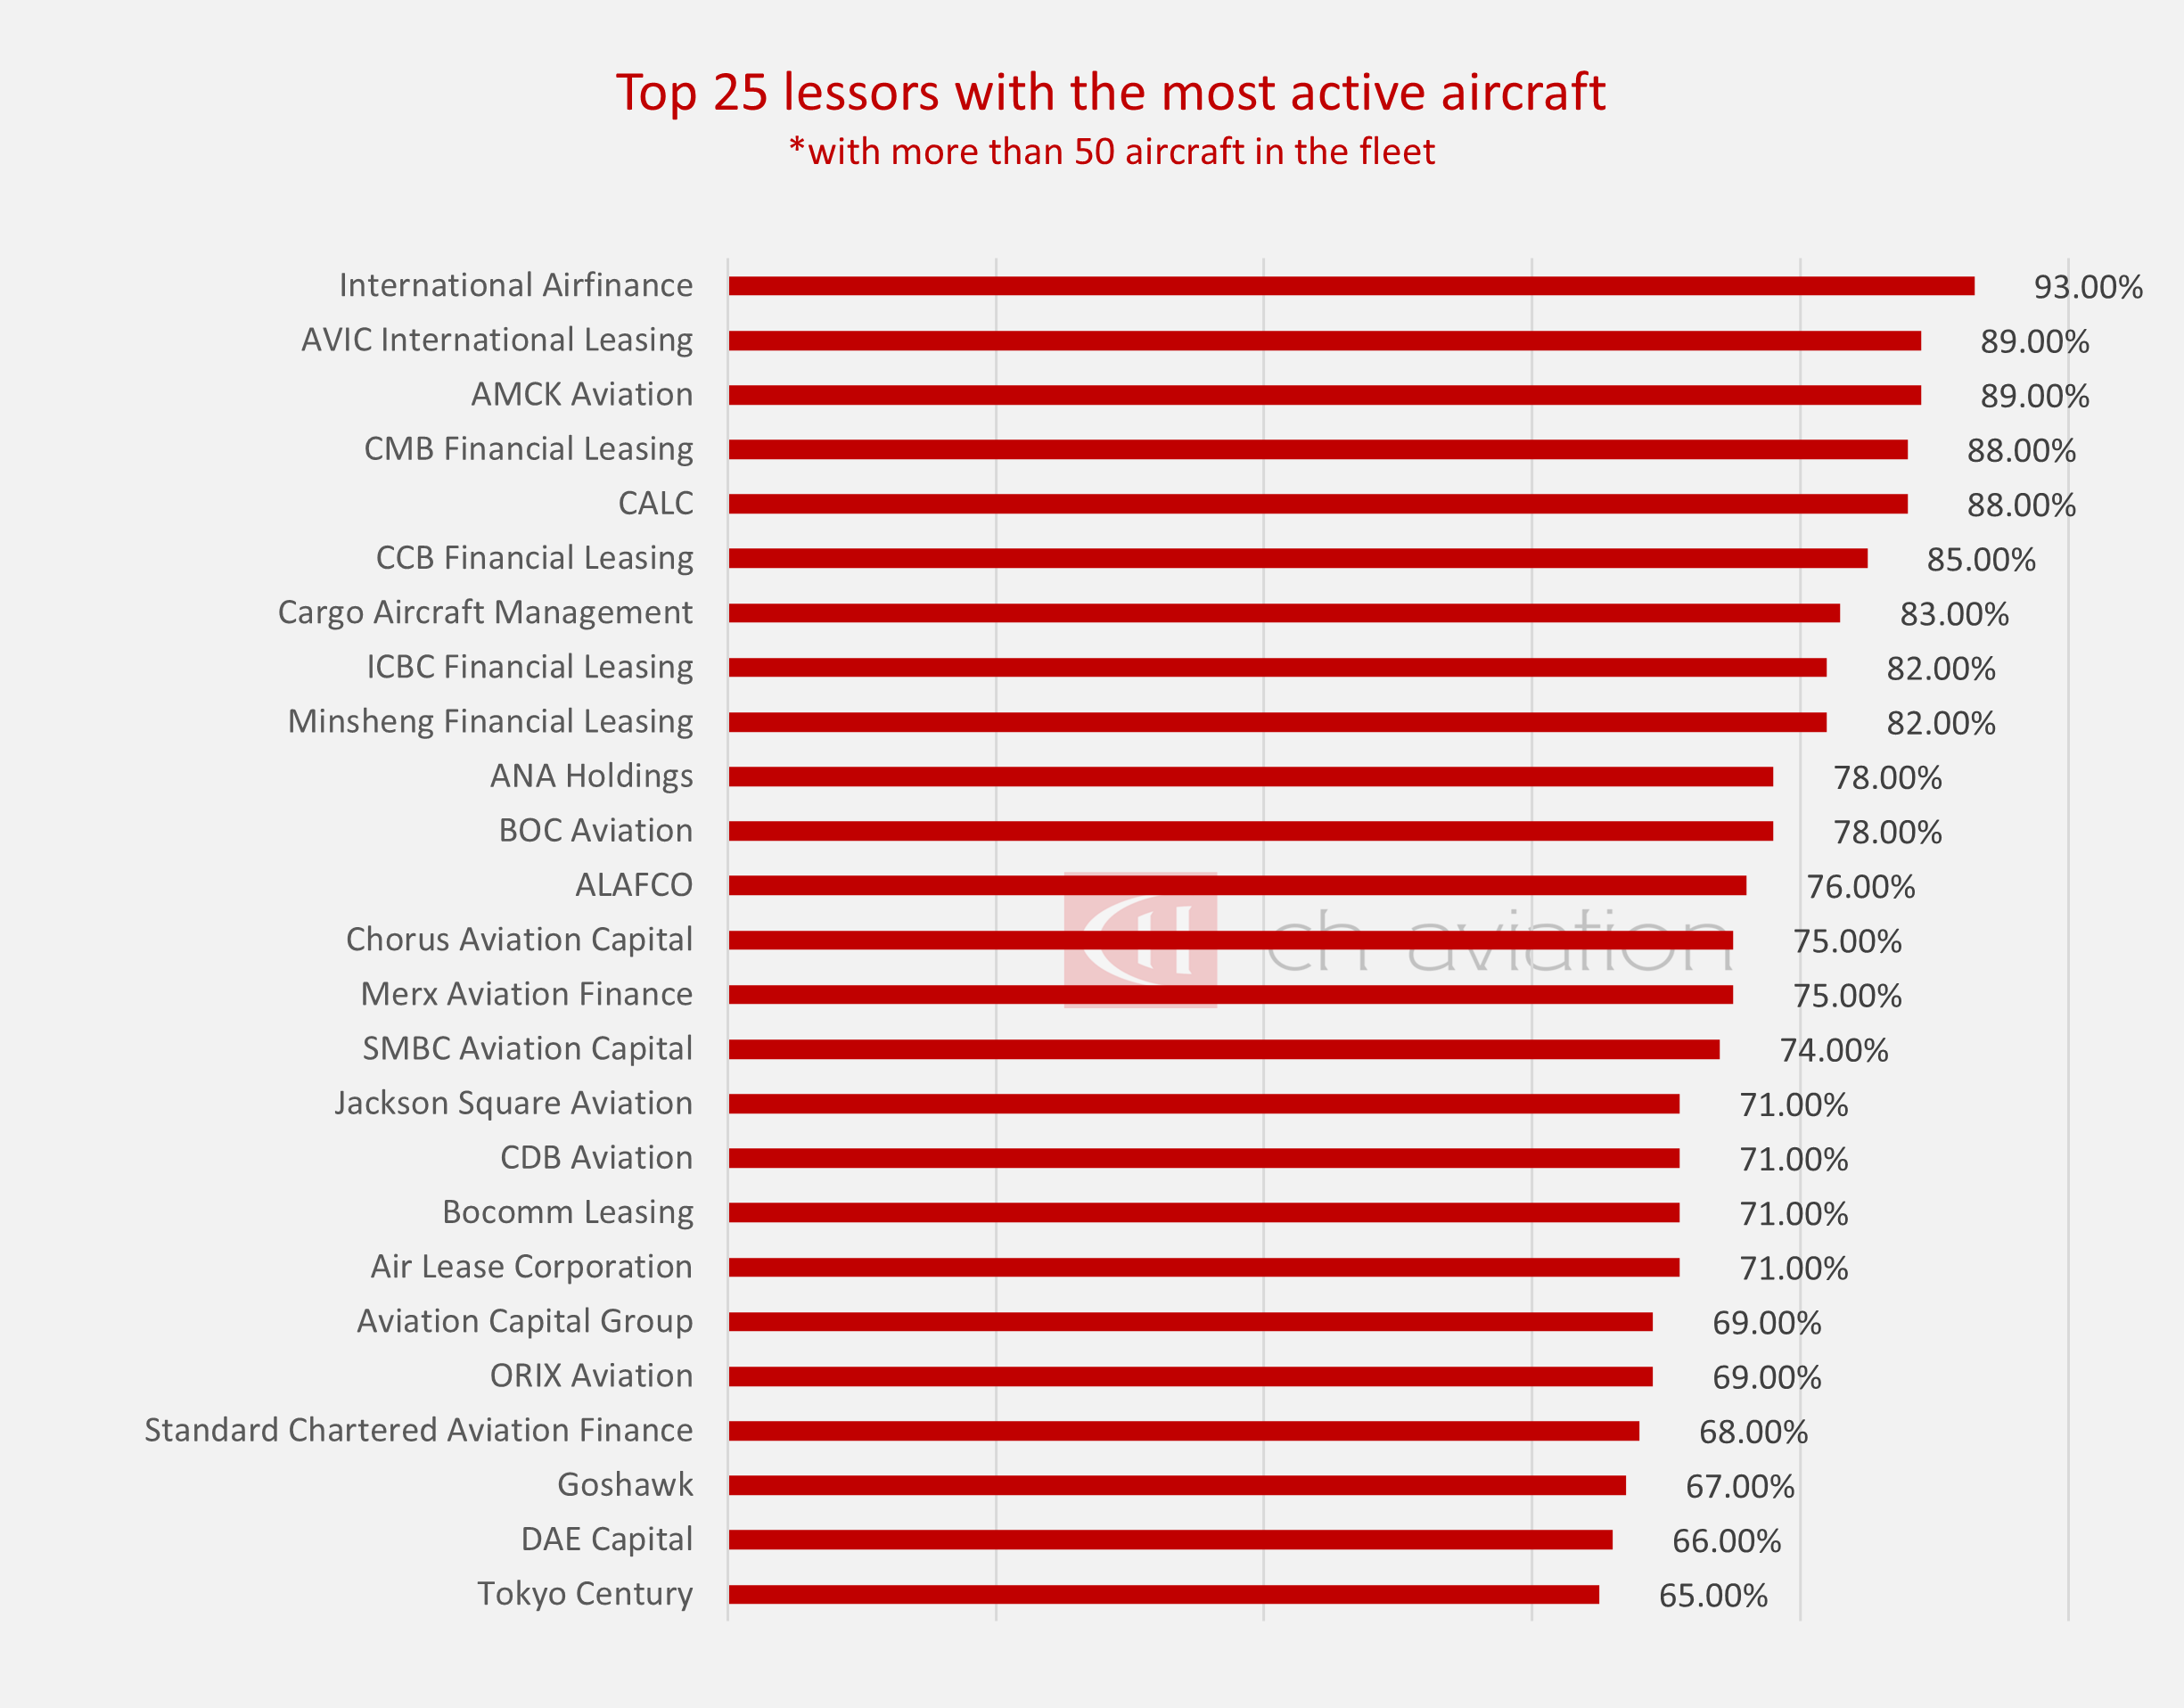
We use ch-aviation fleets advanced and fleets ownership data for this analysis. To get the full and detailed insights on active and inactive aircraft, visit the following LINK.