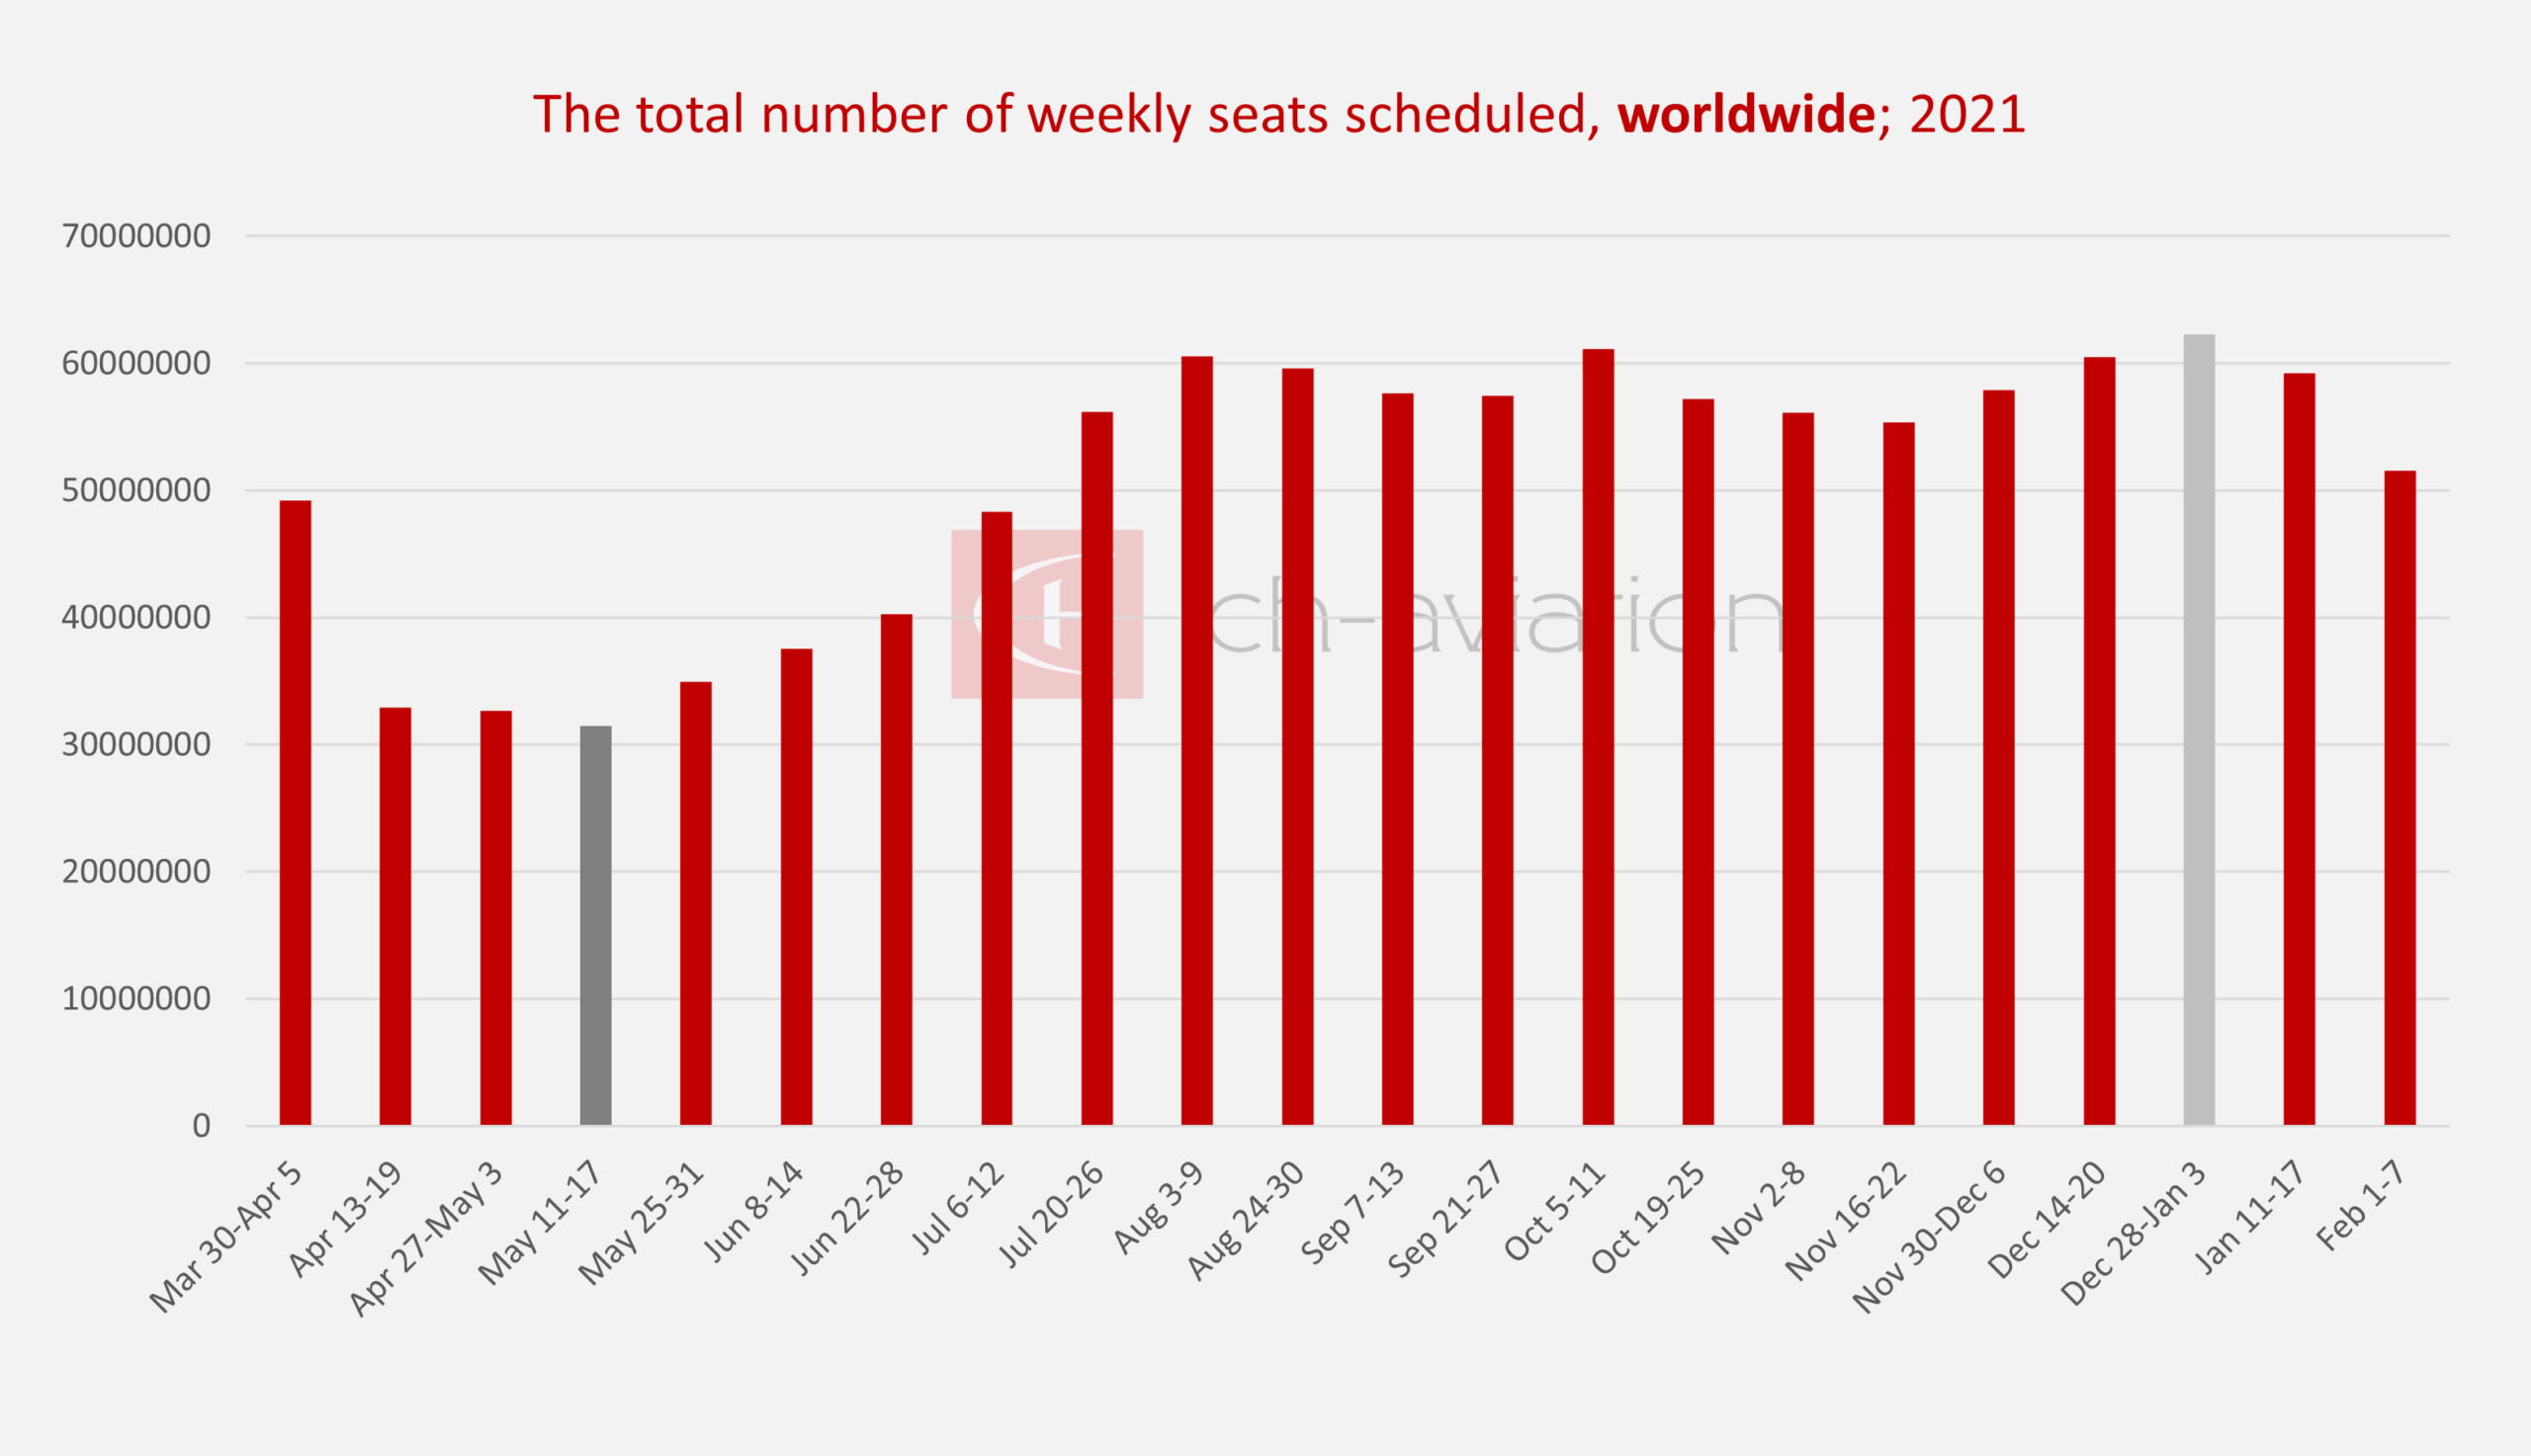
At the beginning of February, capacity numbers keep dropping, and at the moment, the Industry’s global size counts 51.5 million seats per week.
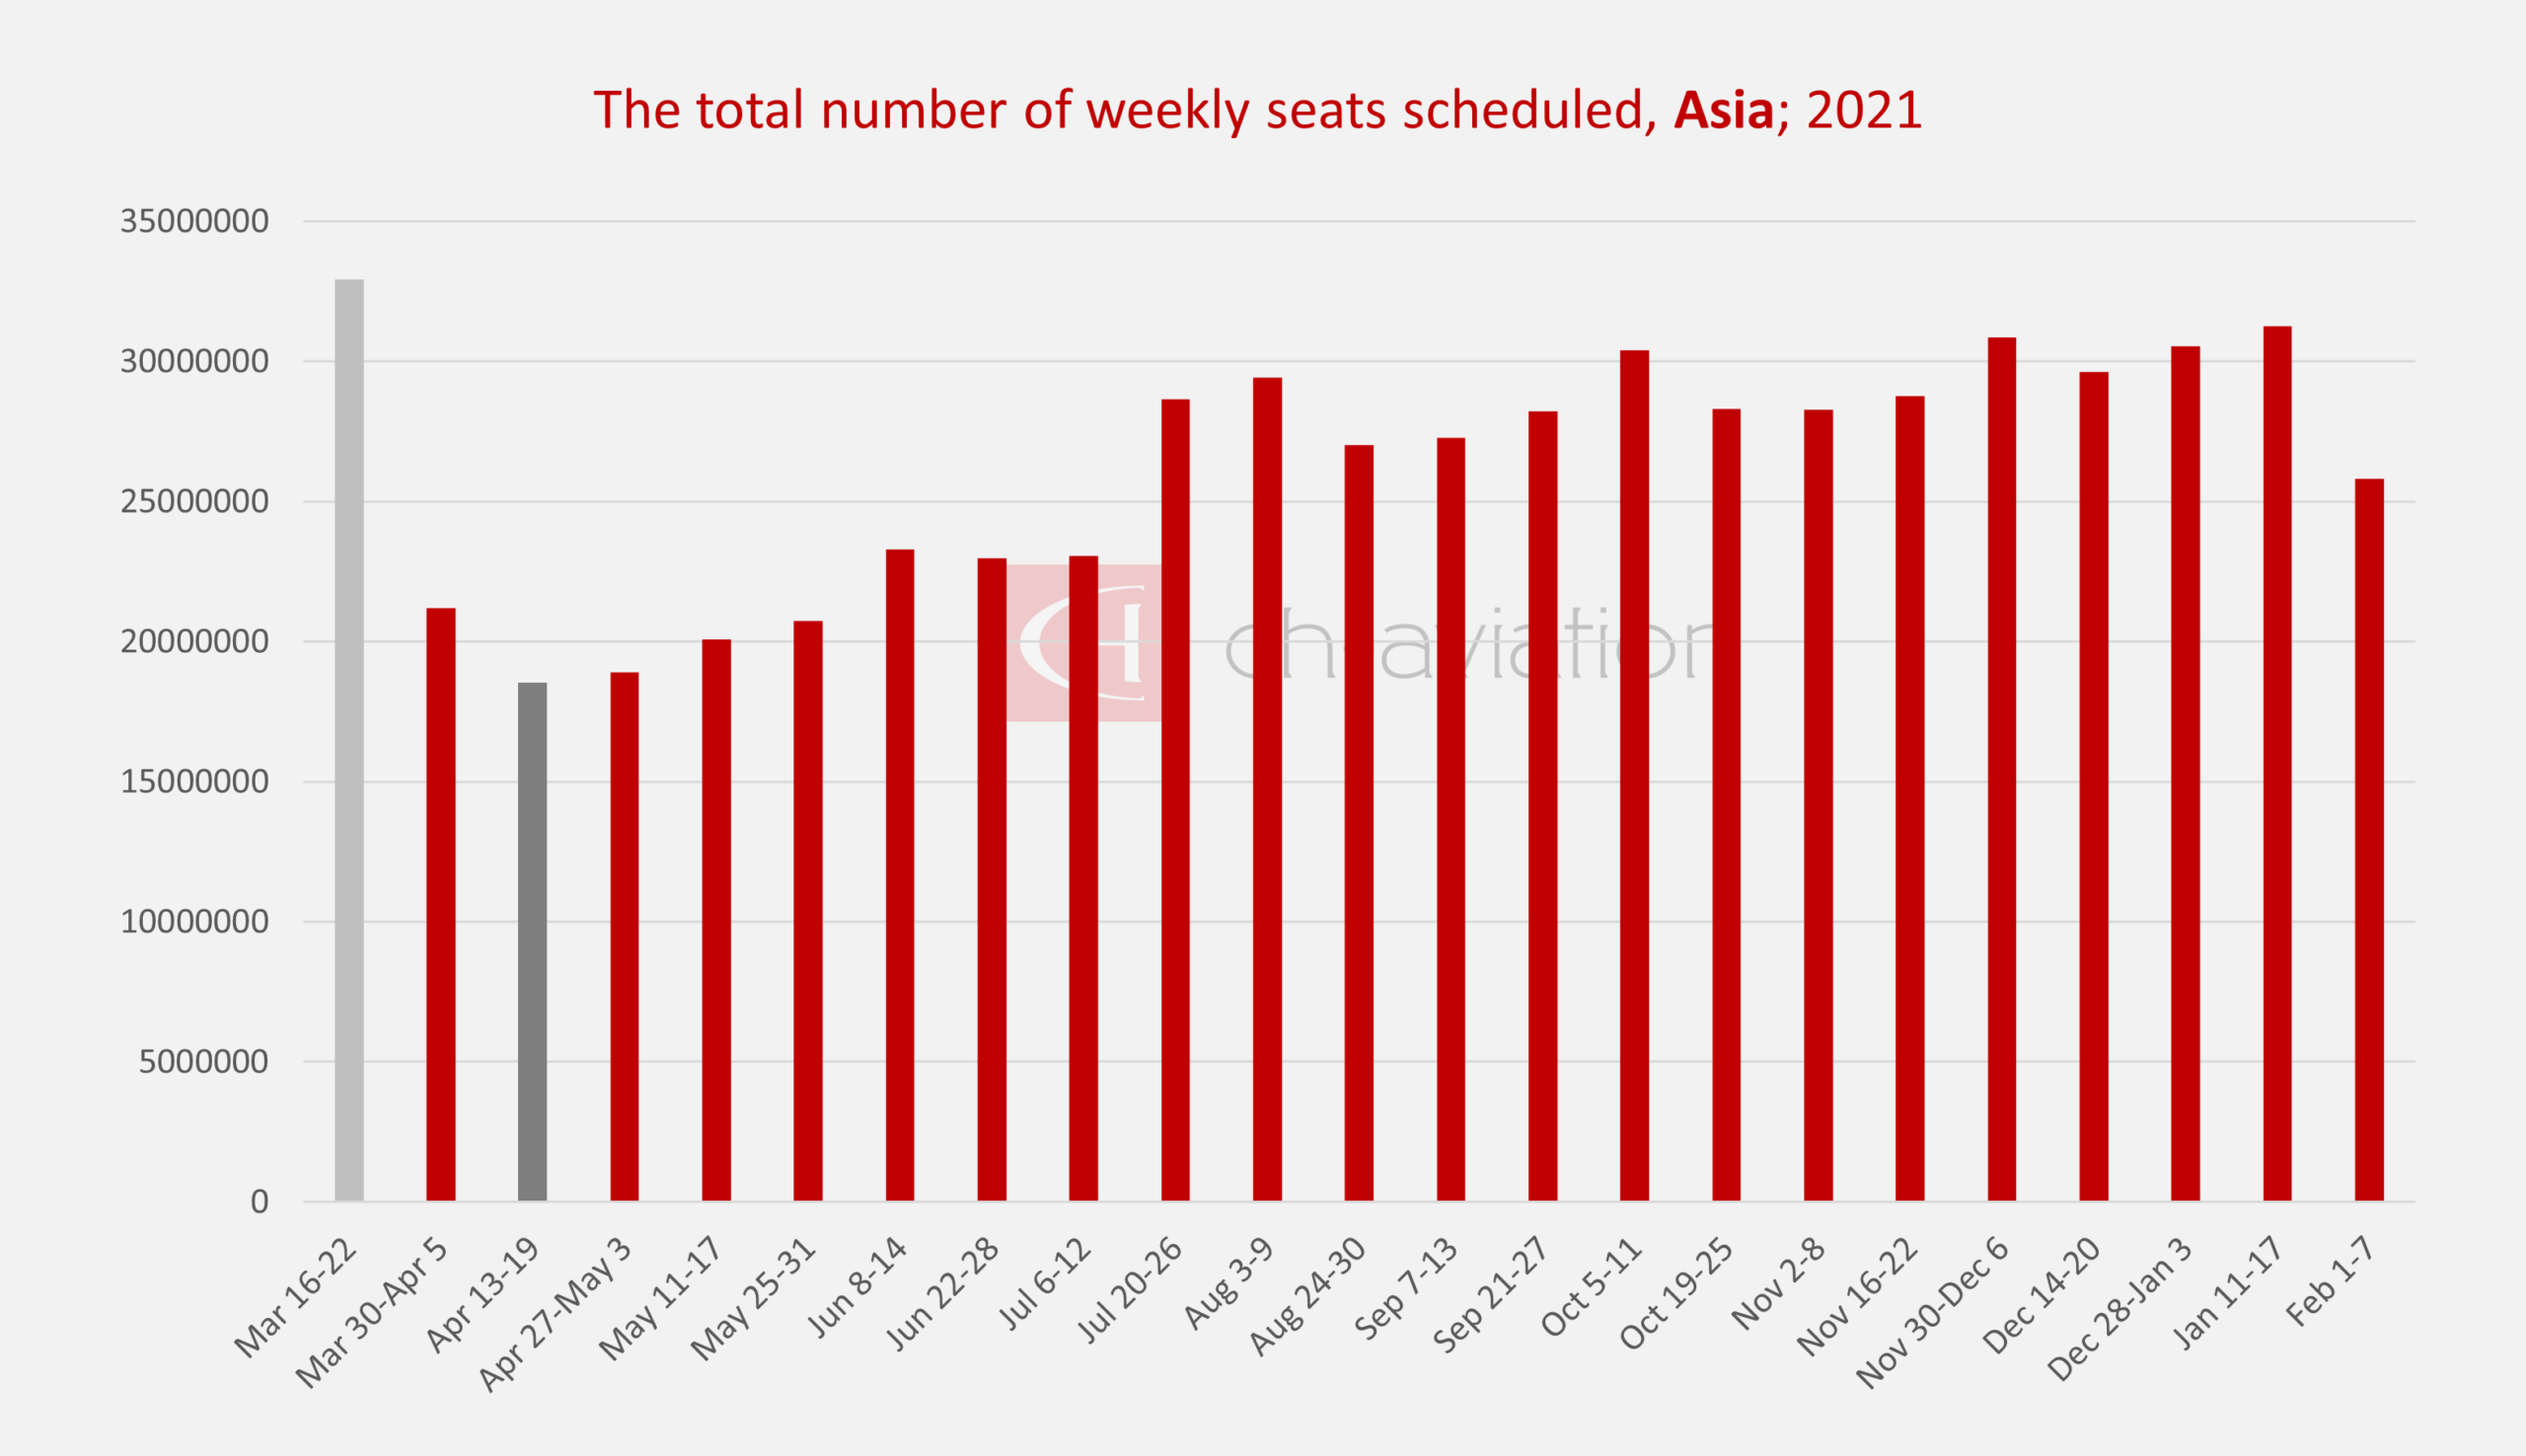
After an unstable growth trend until the end of January, Asian capacity shows a significant drop at the beginning of February, counting 25.8 million seats.
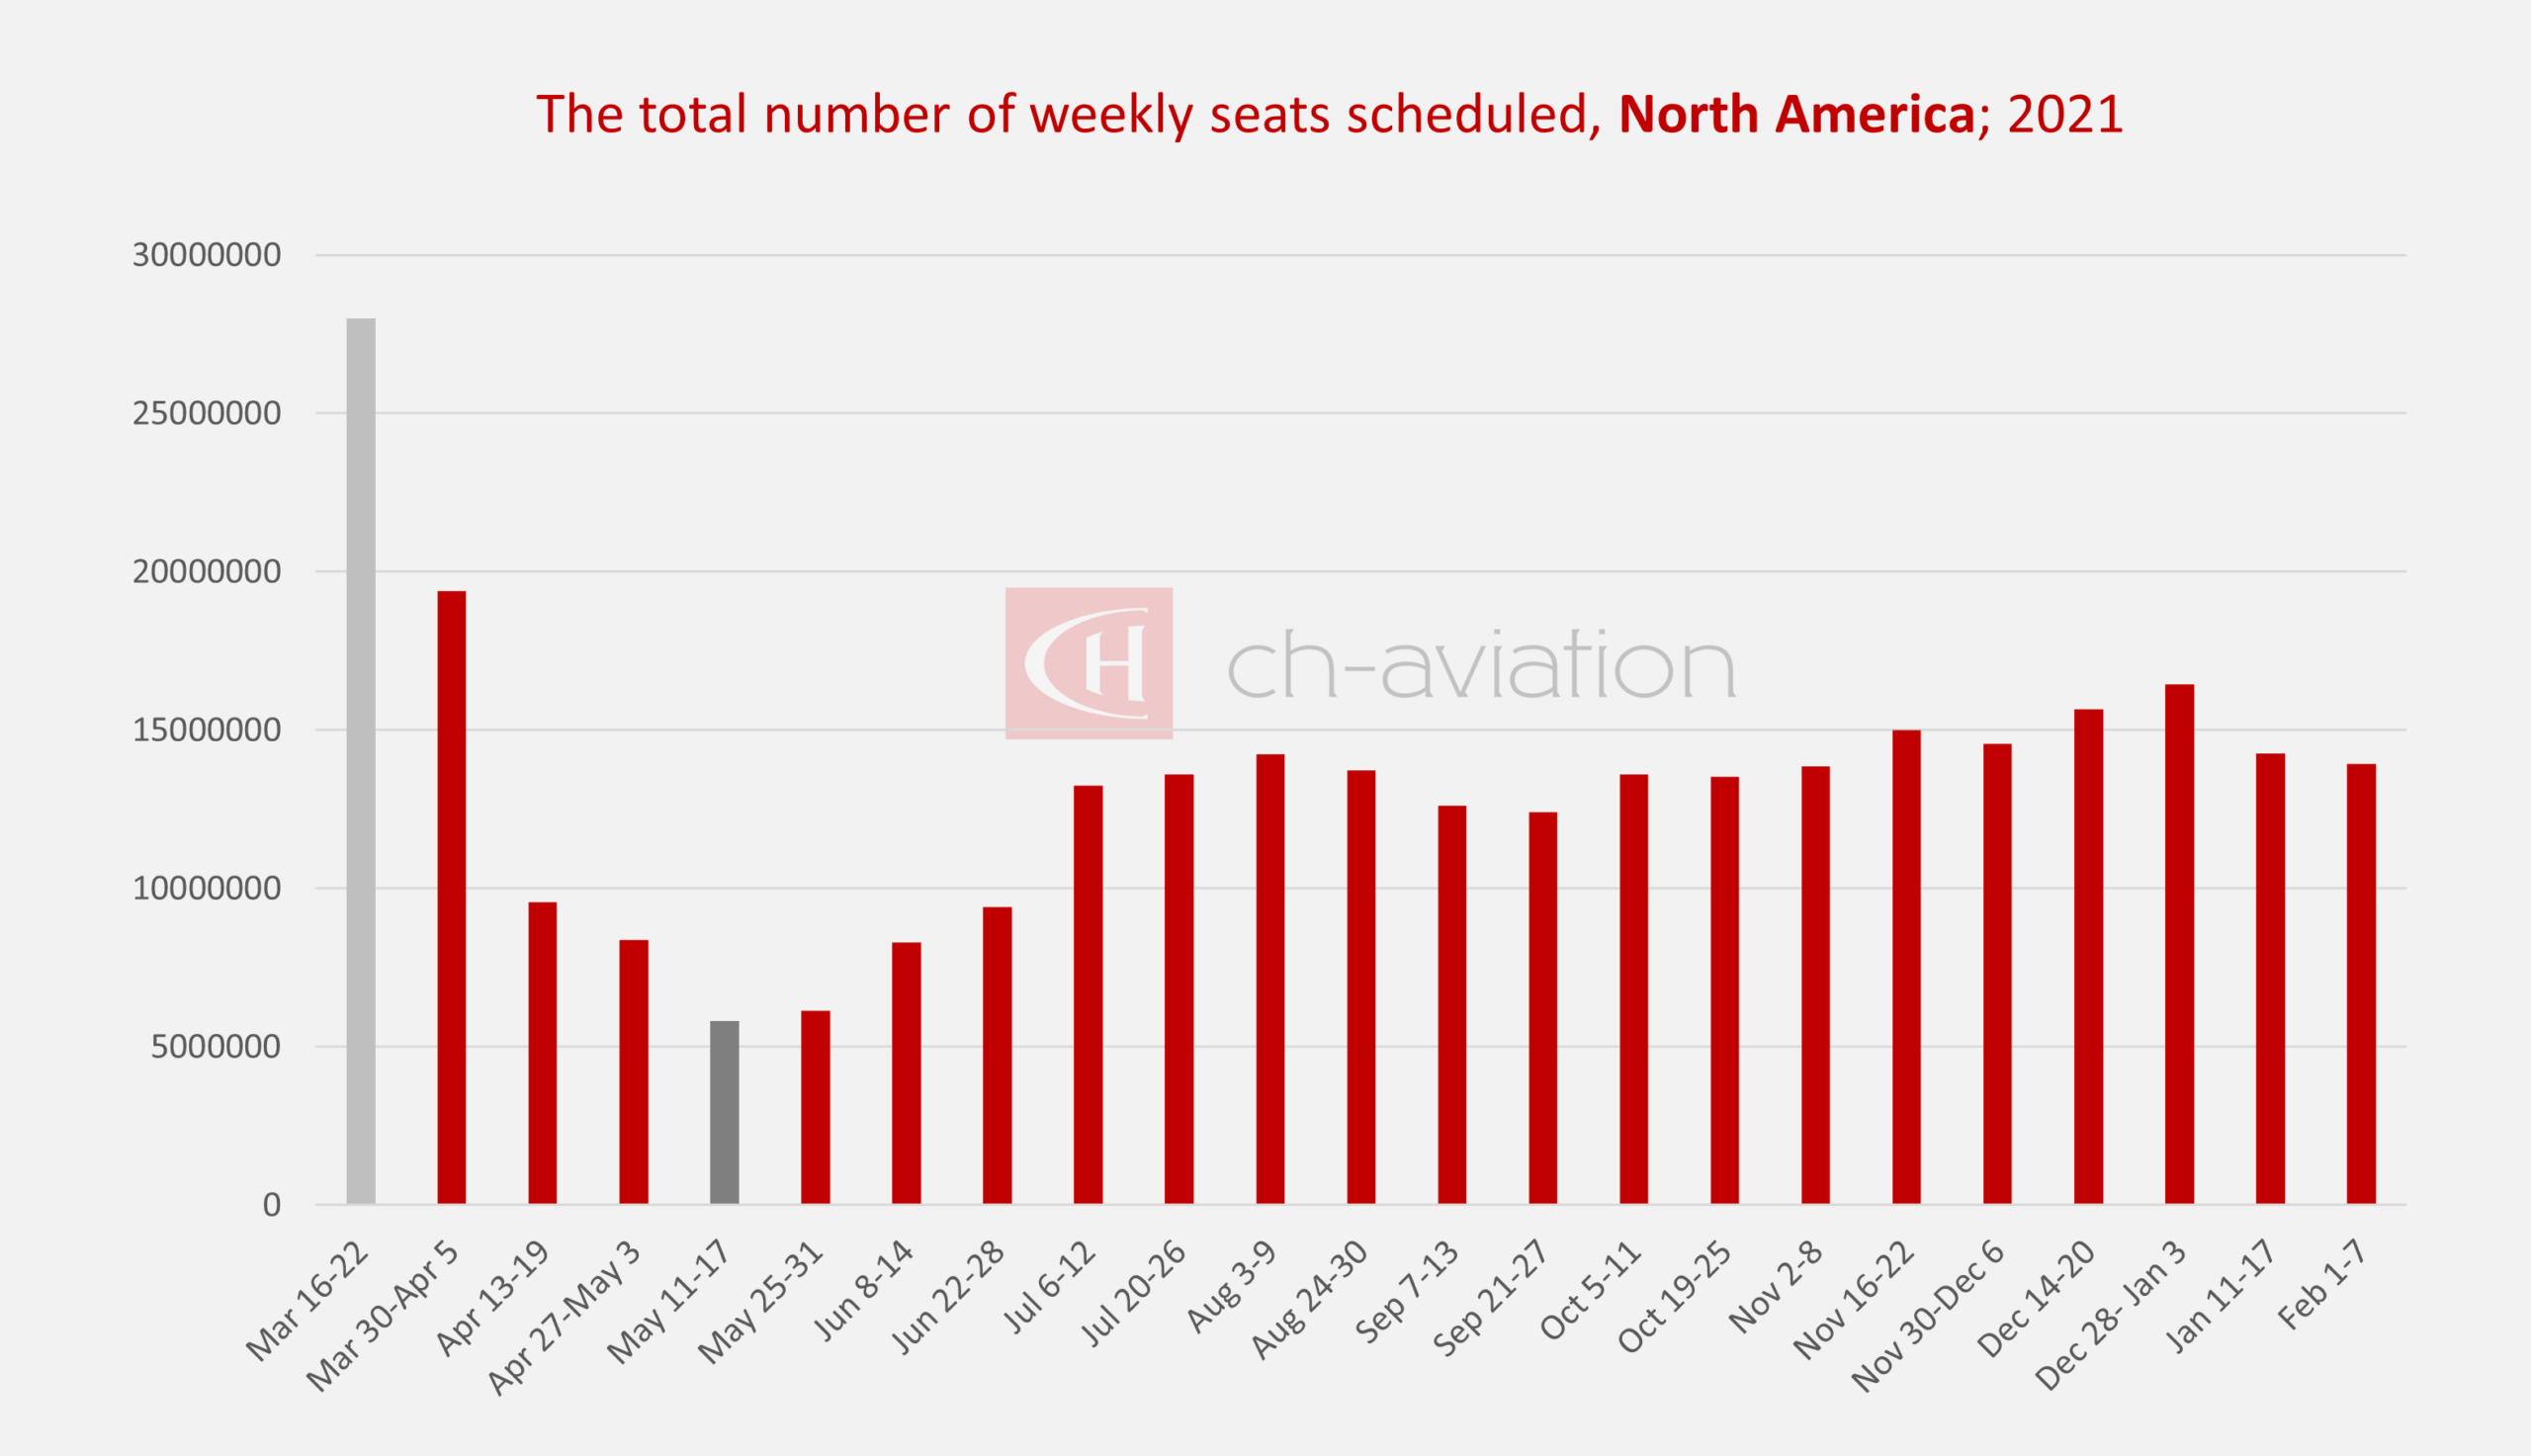
After a nominal growth during December and the beginning of January, North America’s capacity numbers are decreasing until now, with a total of 13.9 million scheduled seats per week.
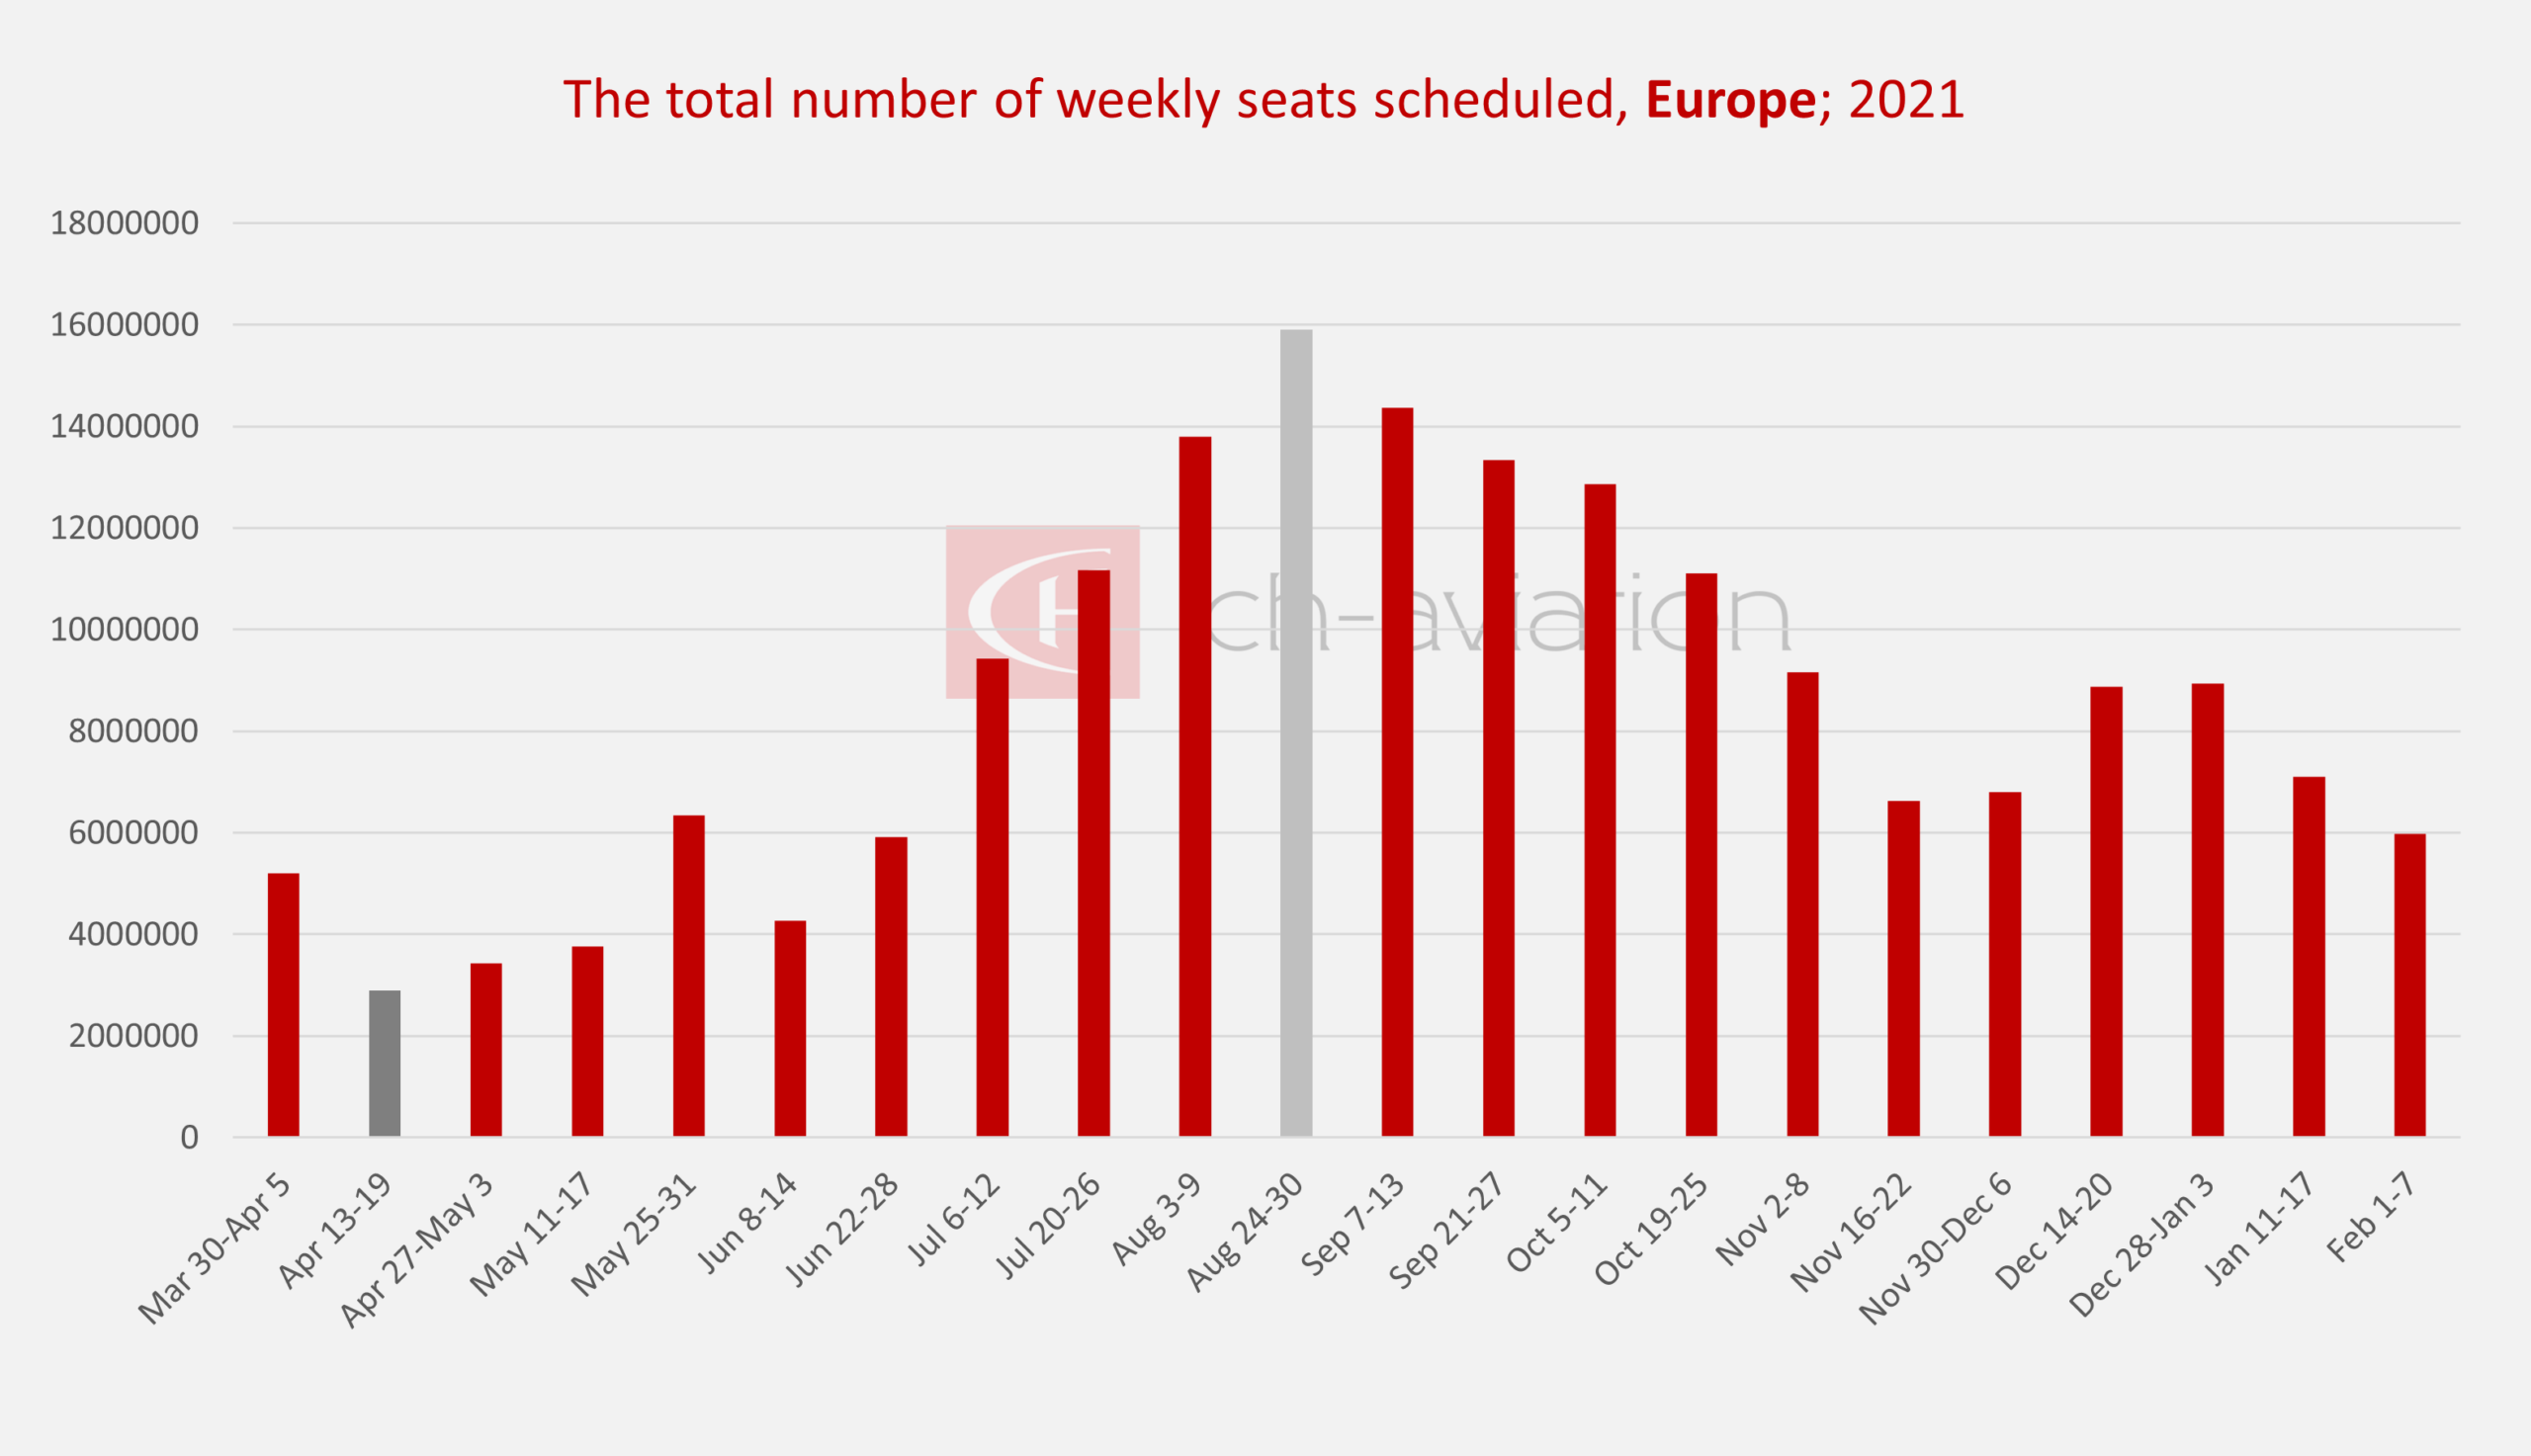
After a short recovery in December, due to increased demand during the holiday season, European capacity numbers are significantly decreasing from one week to another. At the beginning of February, the current capacity counts 5.9 million offered seats per week.
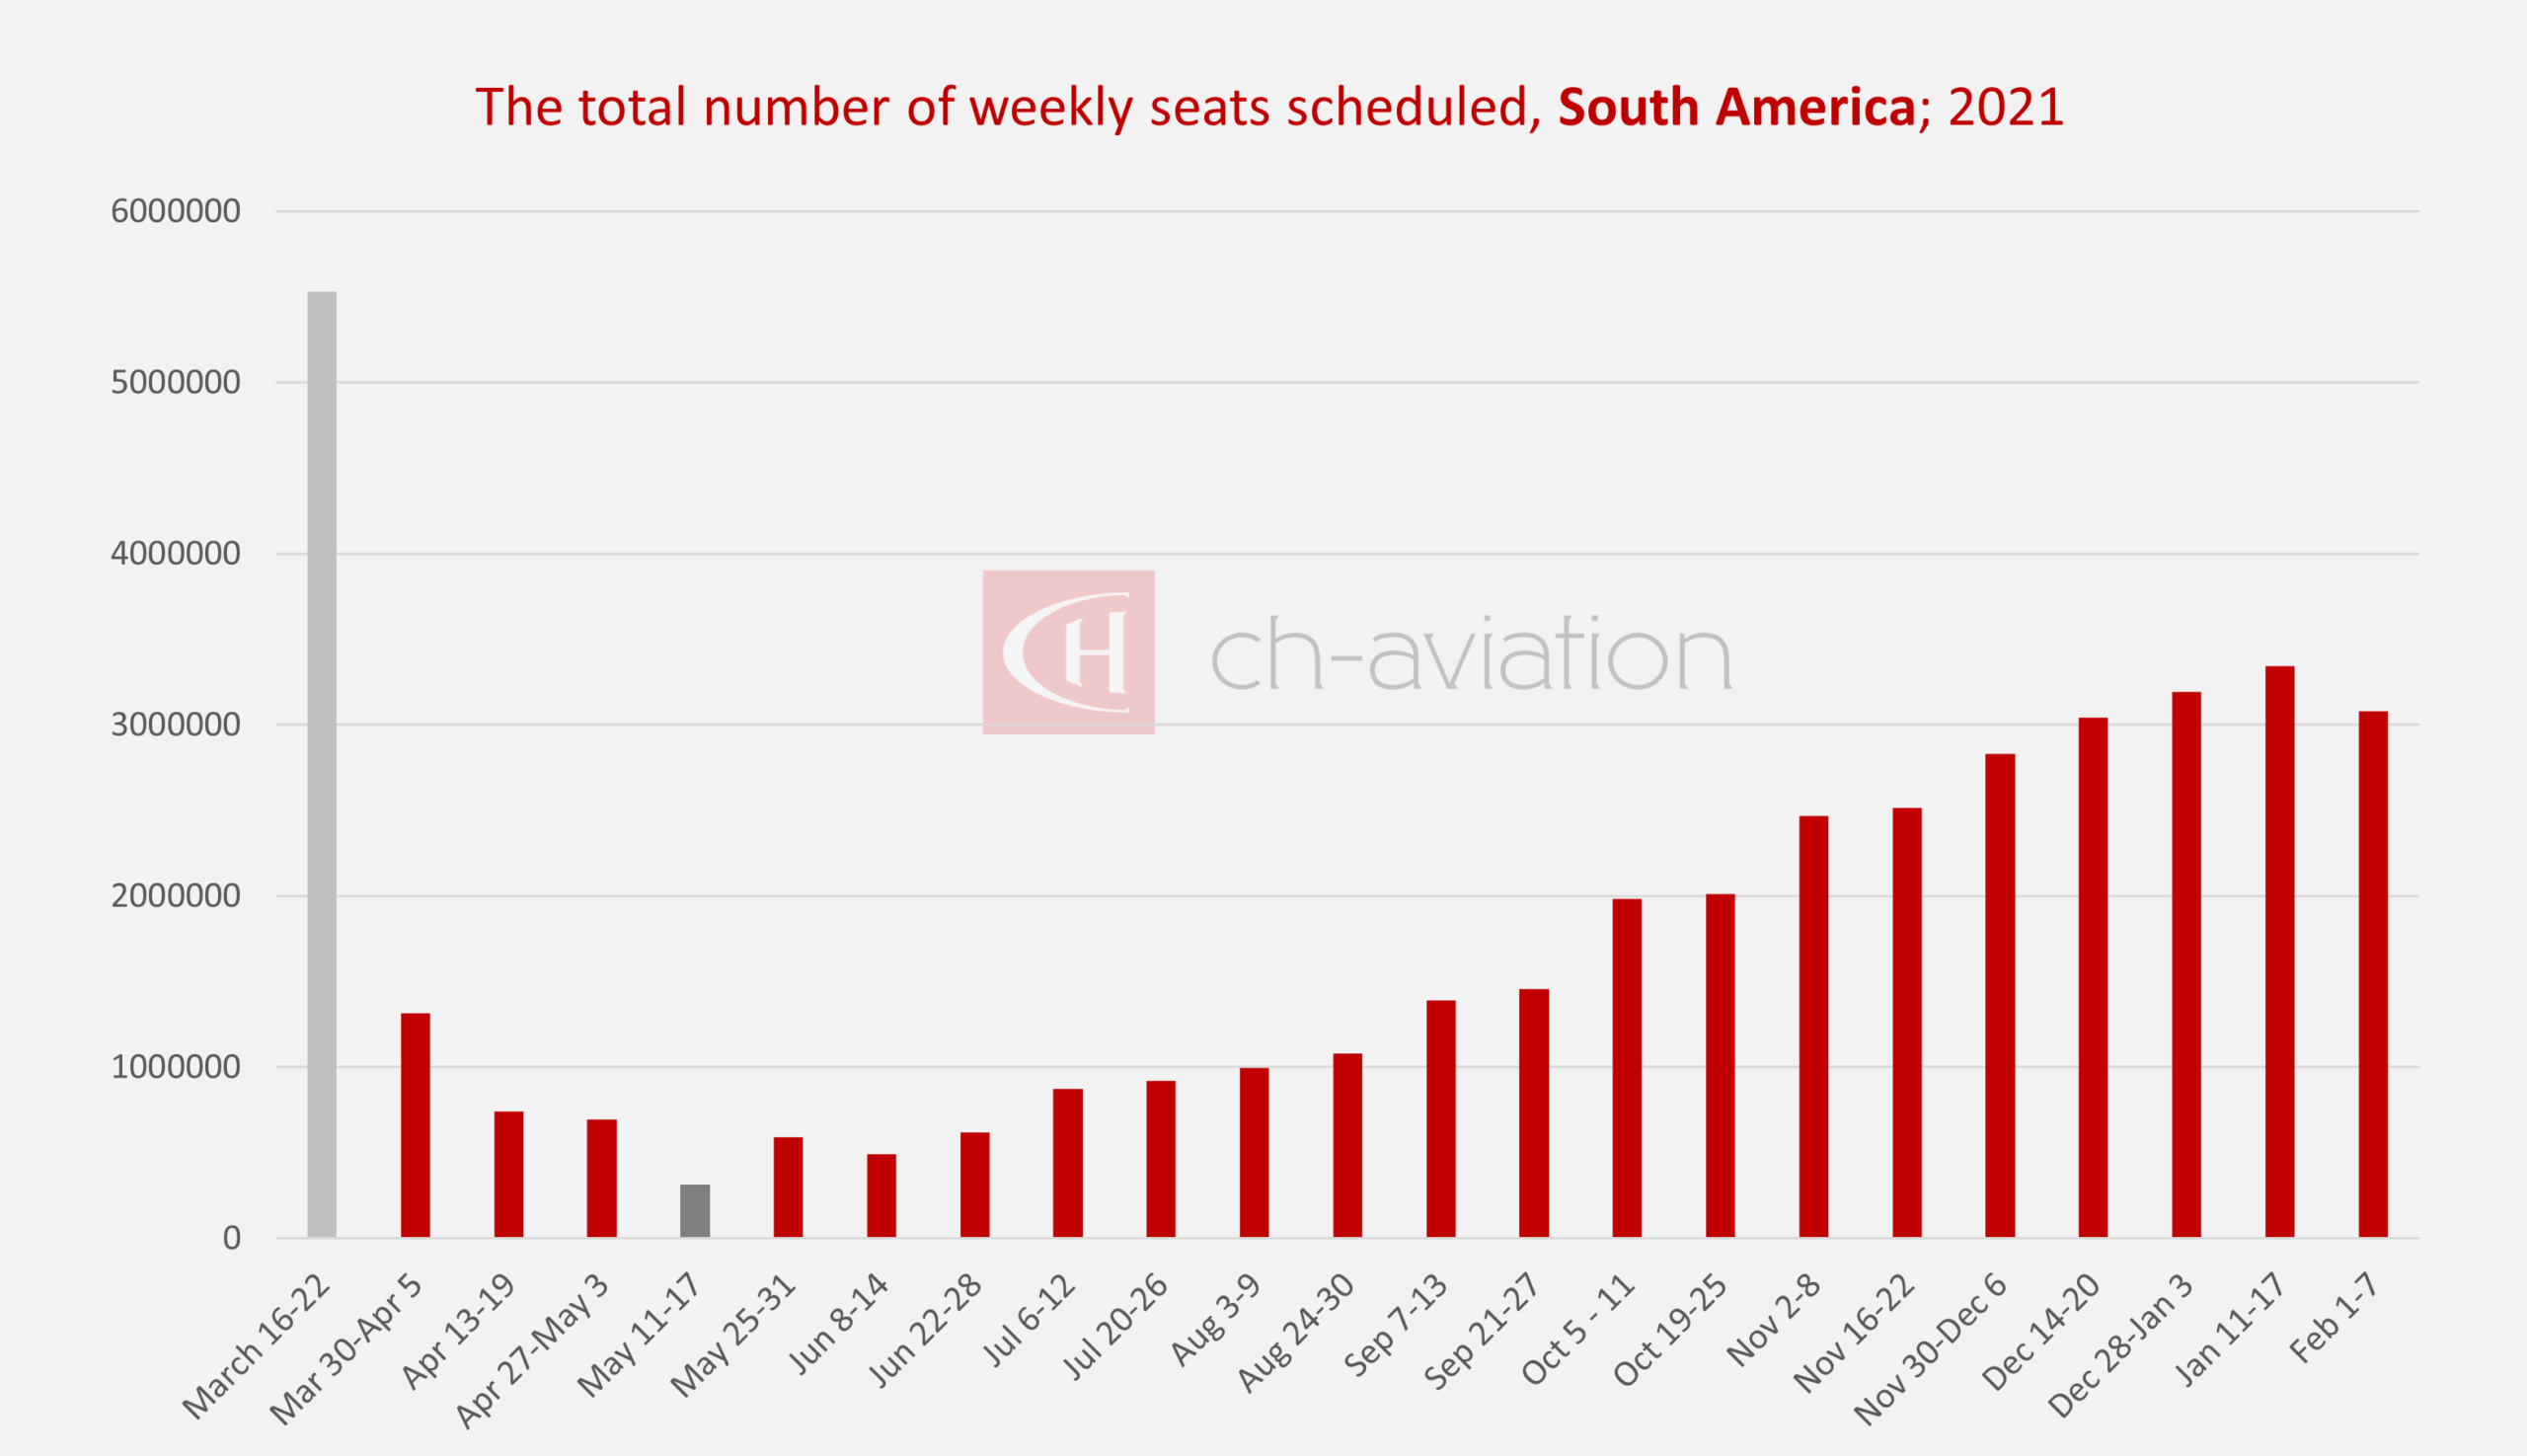
South America was on a stable road to recovery from May until the beginning of January. However, February brought decreasing capacity numbers, now reaching 3 million seats scheduled per week.
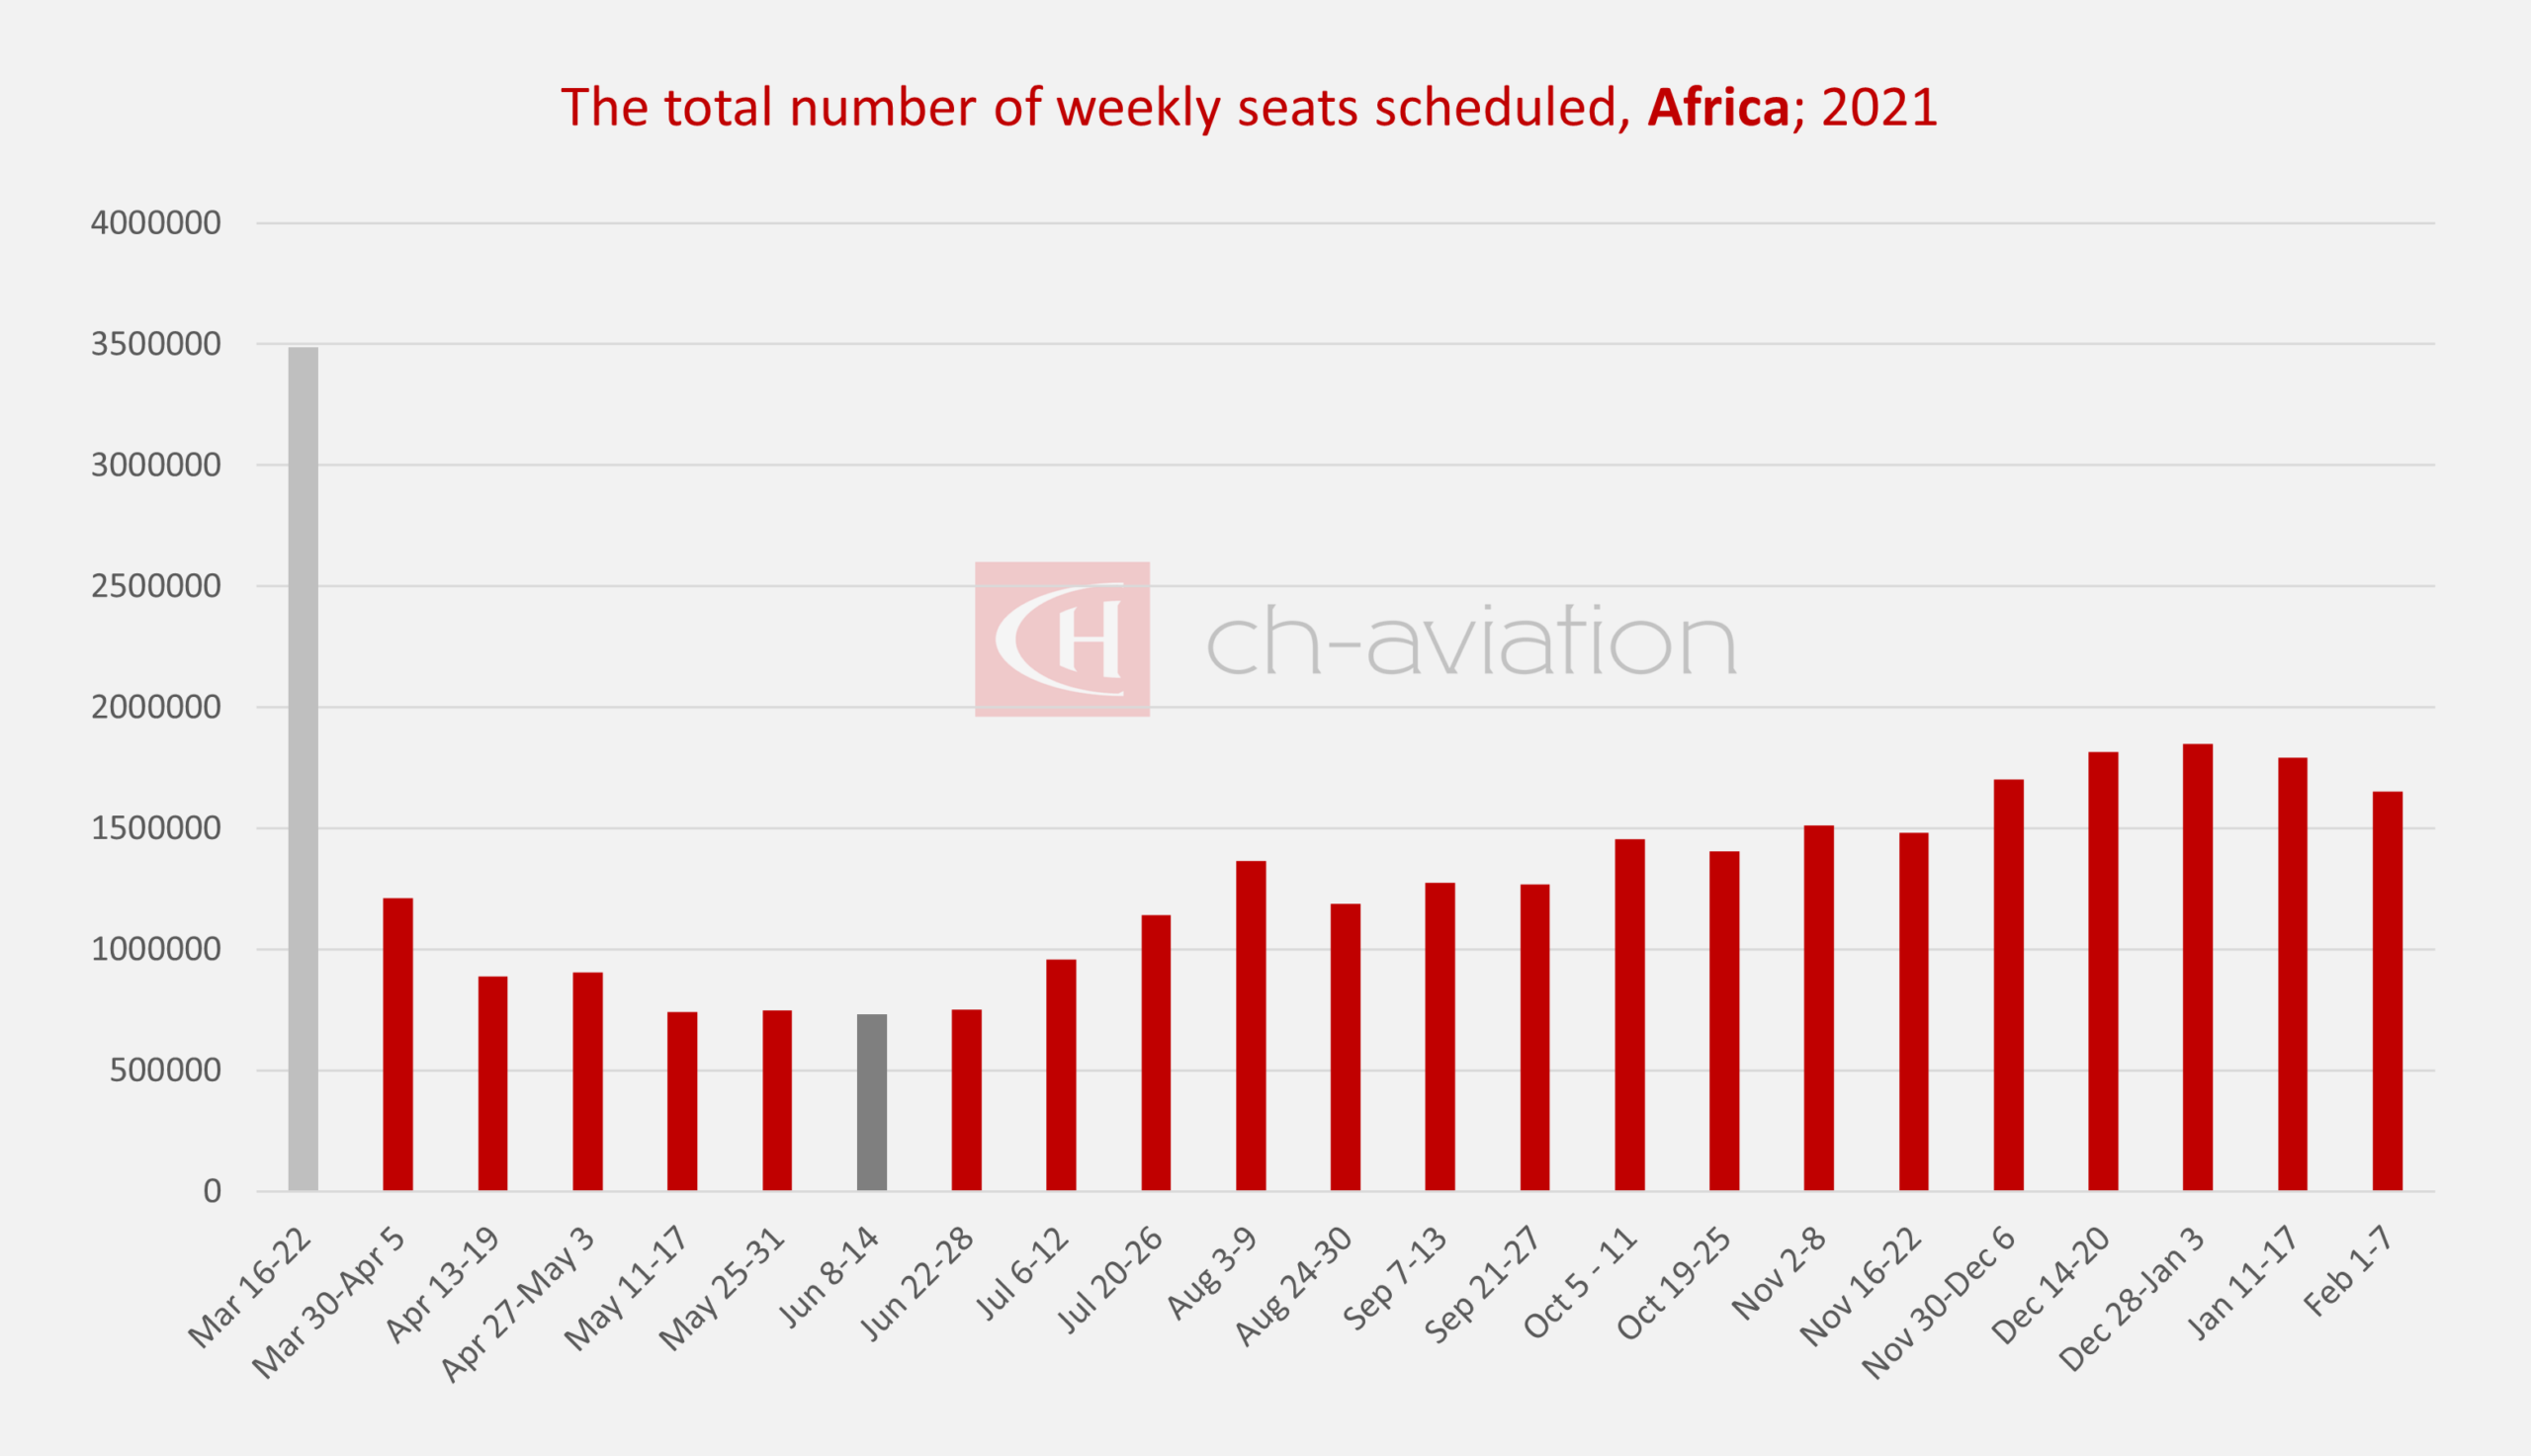
After a stable growing trend from August until the end of 2020, January and February brought another drop in numbers for the African market, which is now counting a total of 1.6 million seats scheduled per week.
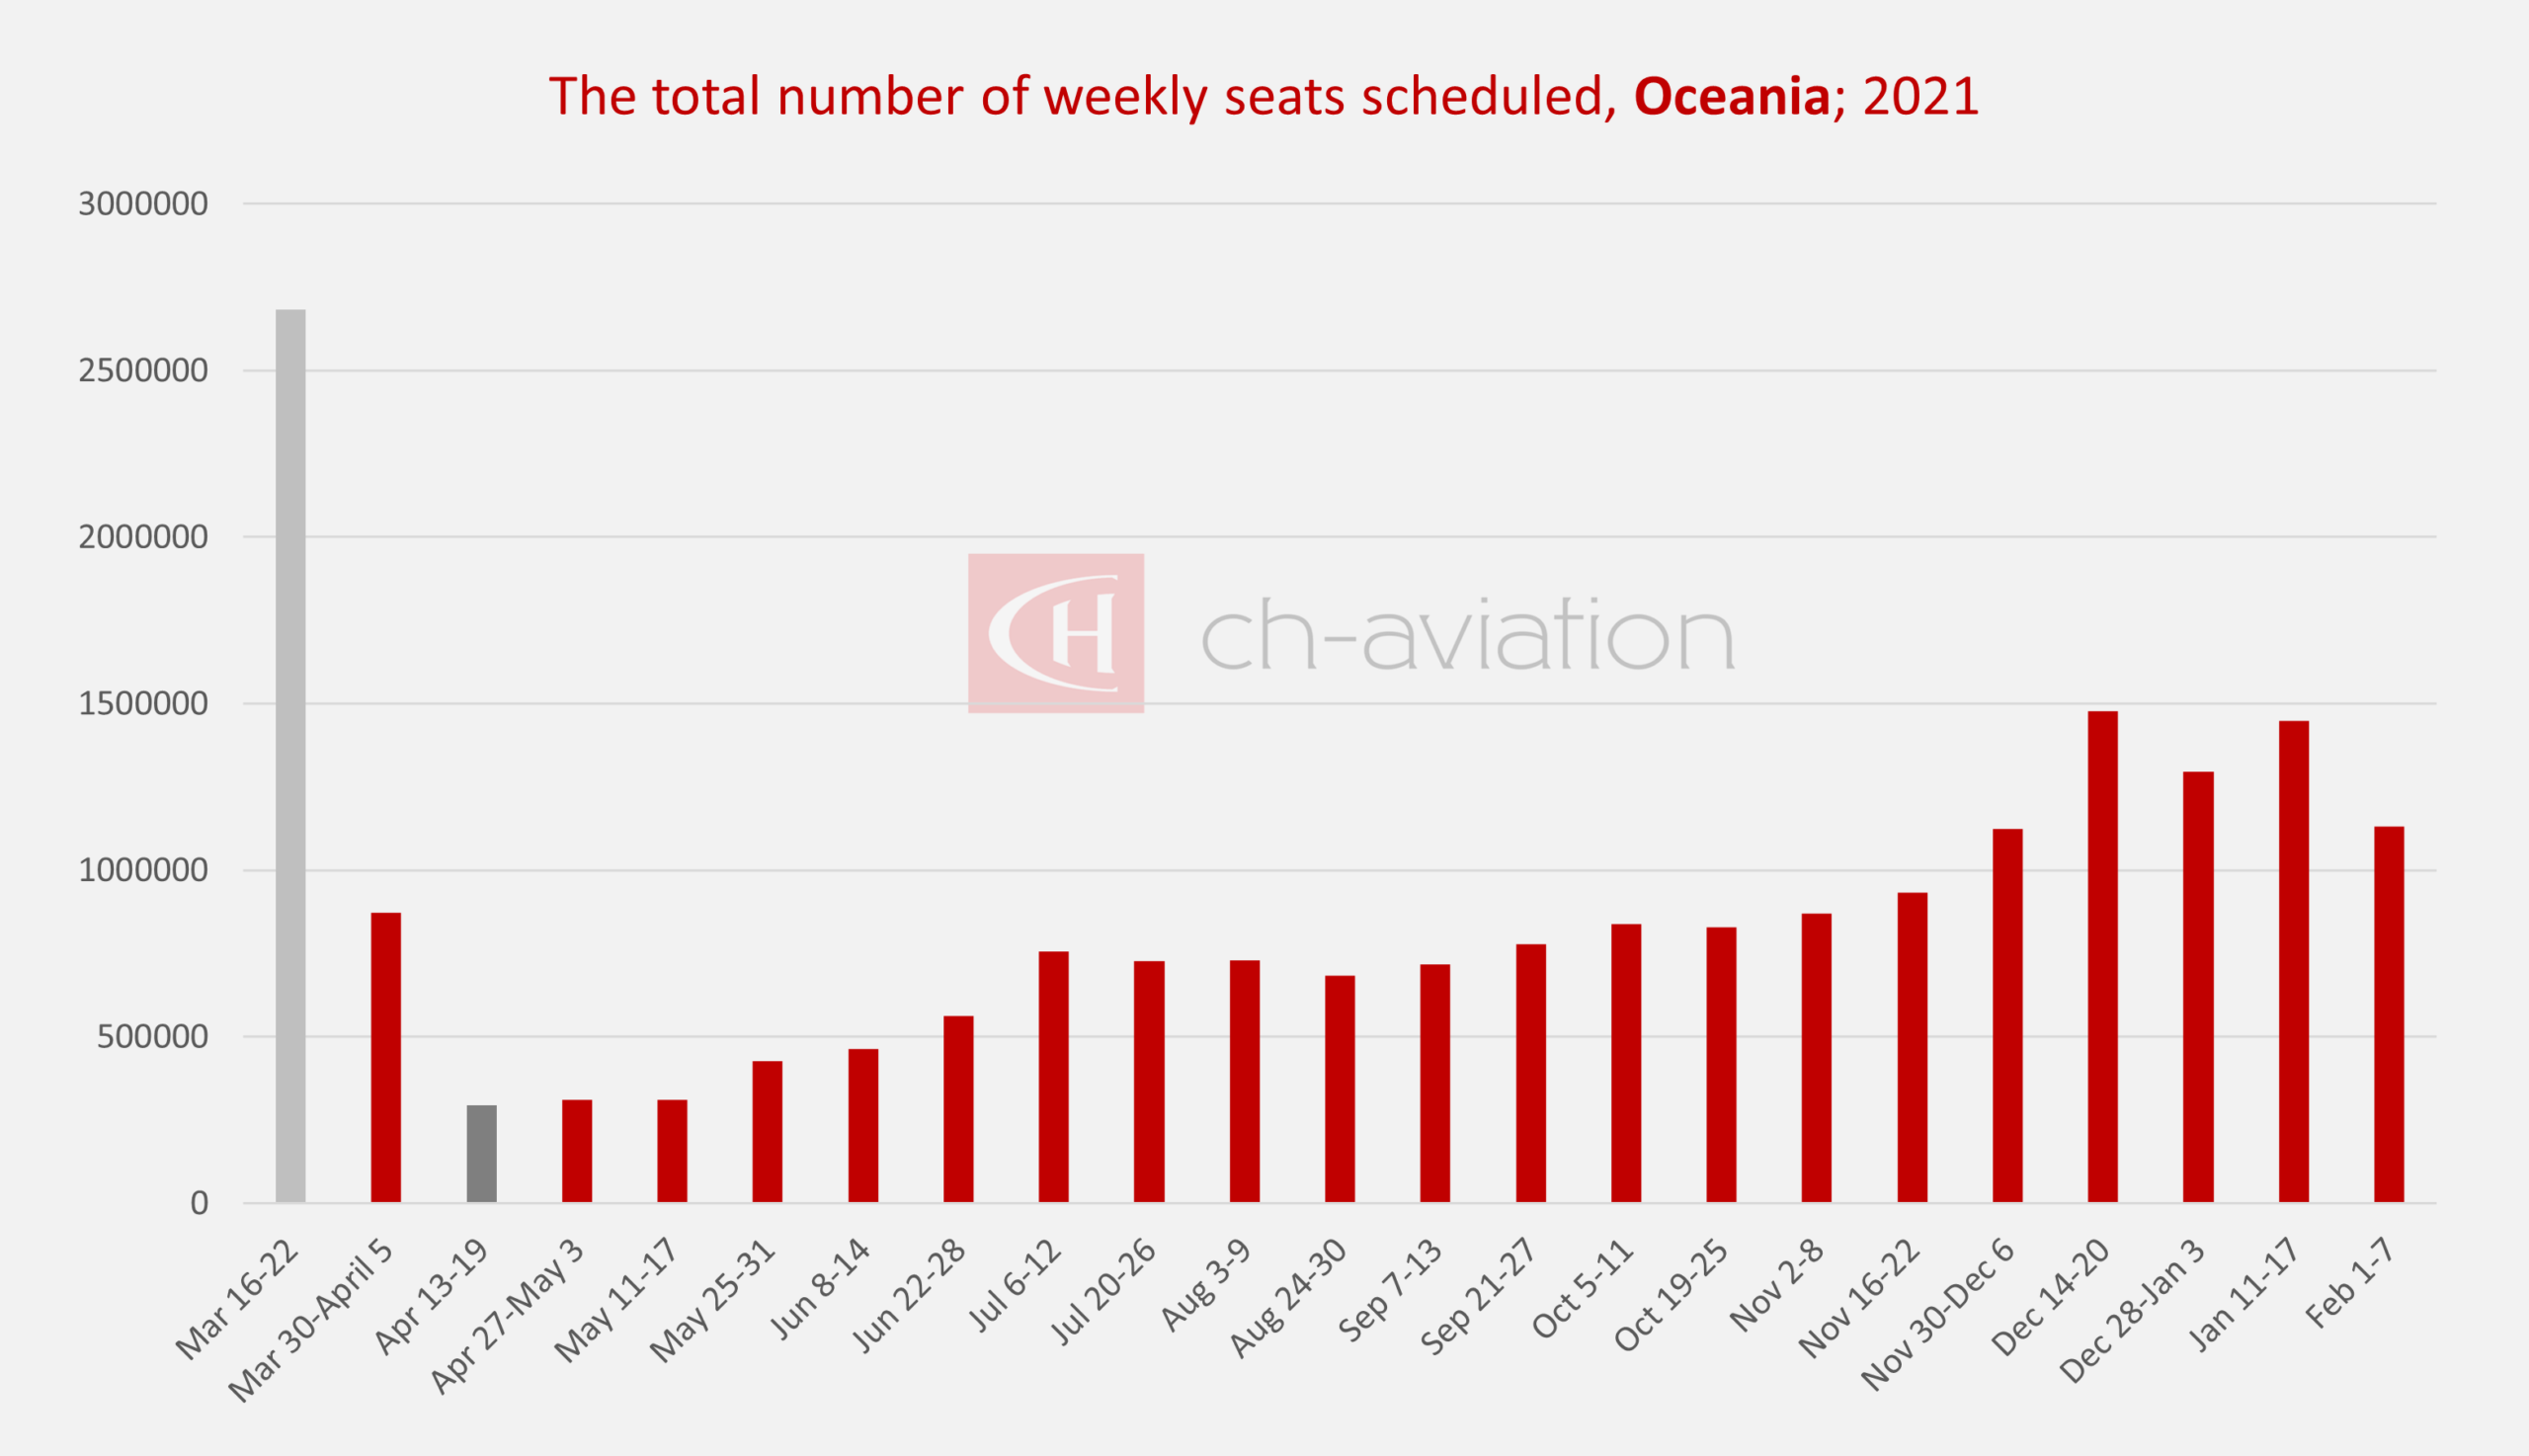
We have noticed a significant fall in the capacity numbers in Oceania as well. Even though January was optimistic, the beginning of February now counts only 1.1 million offered seats per week.
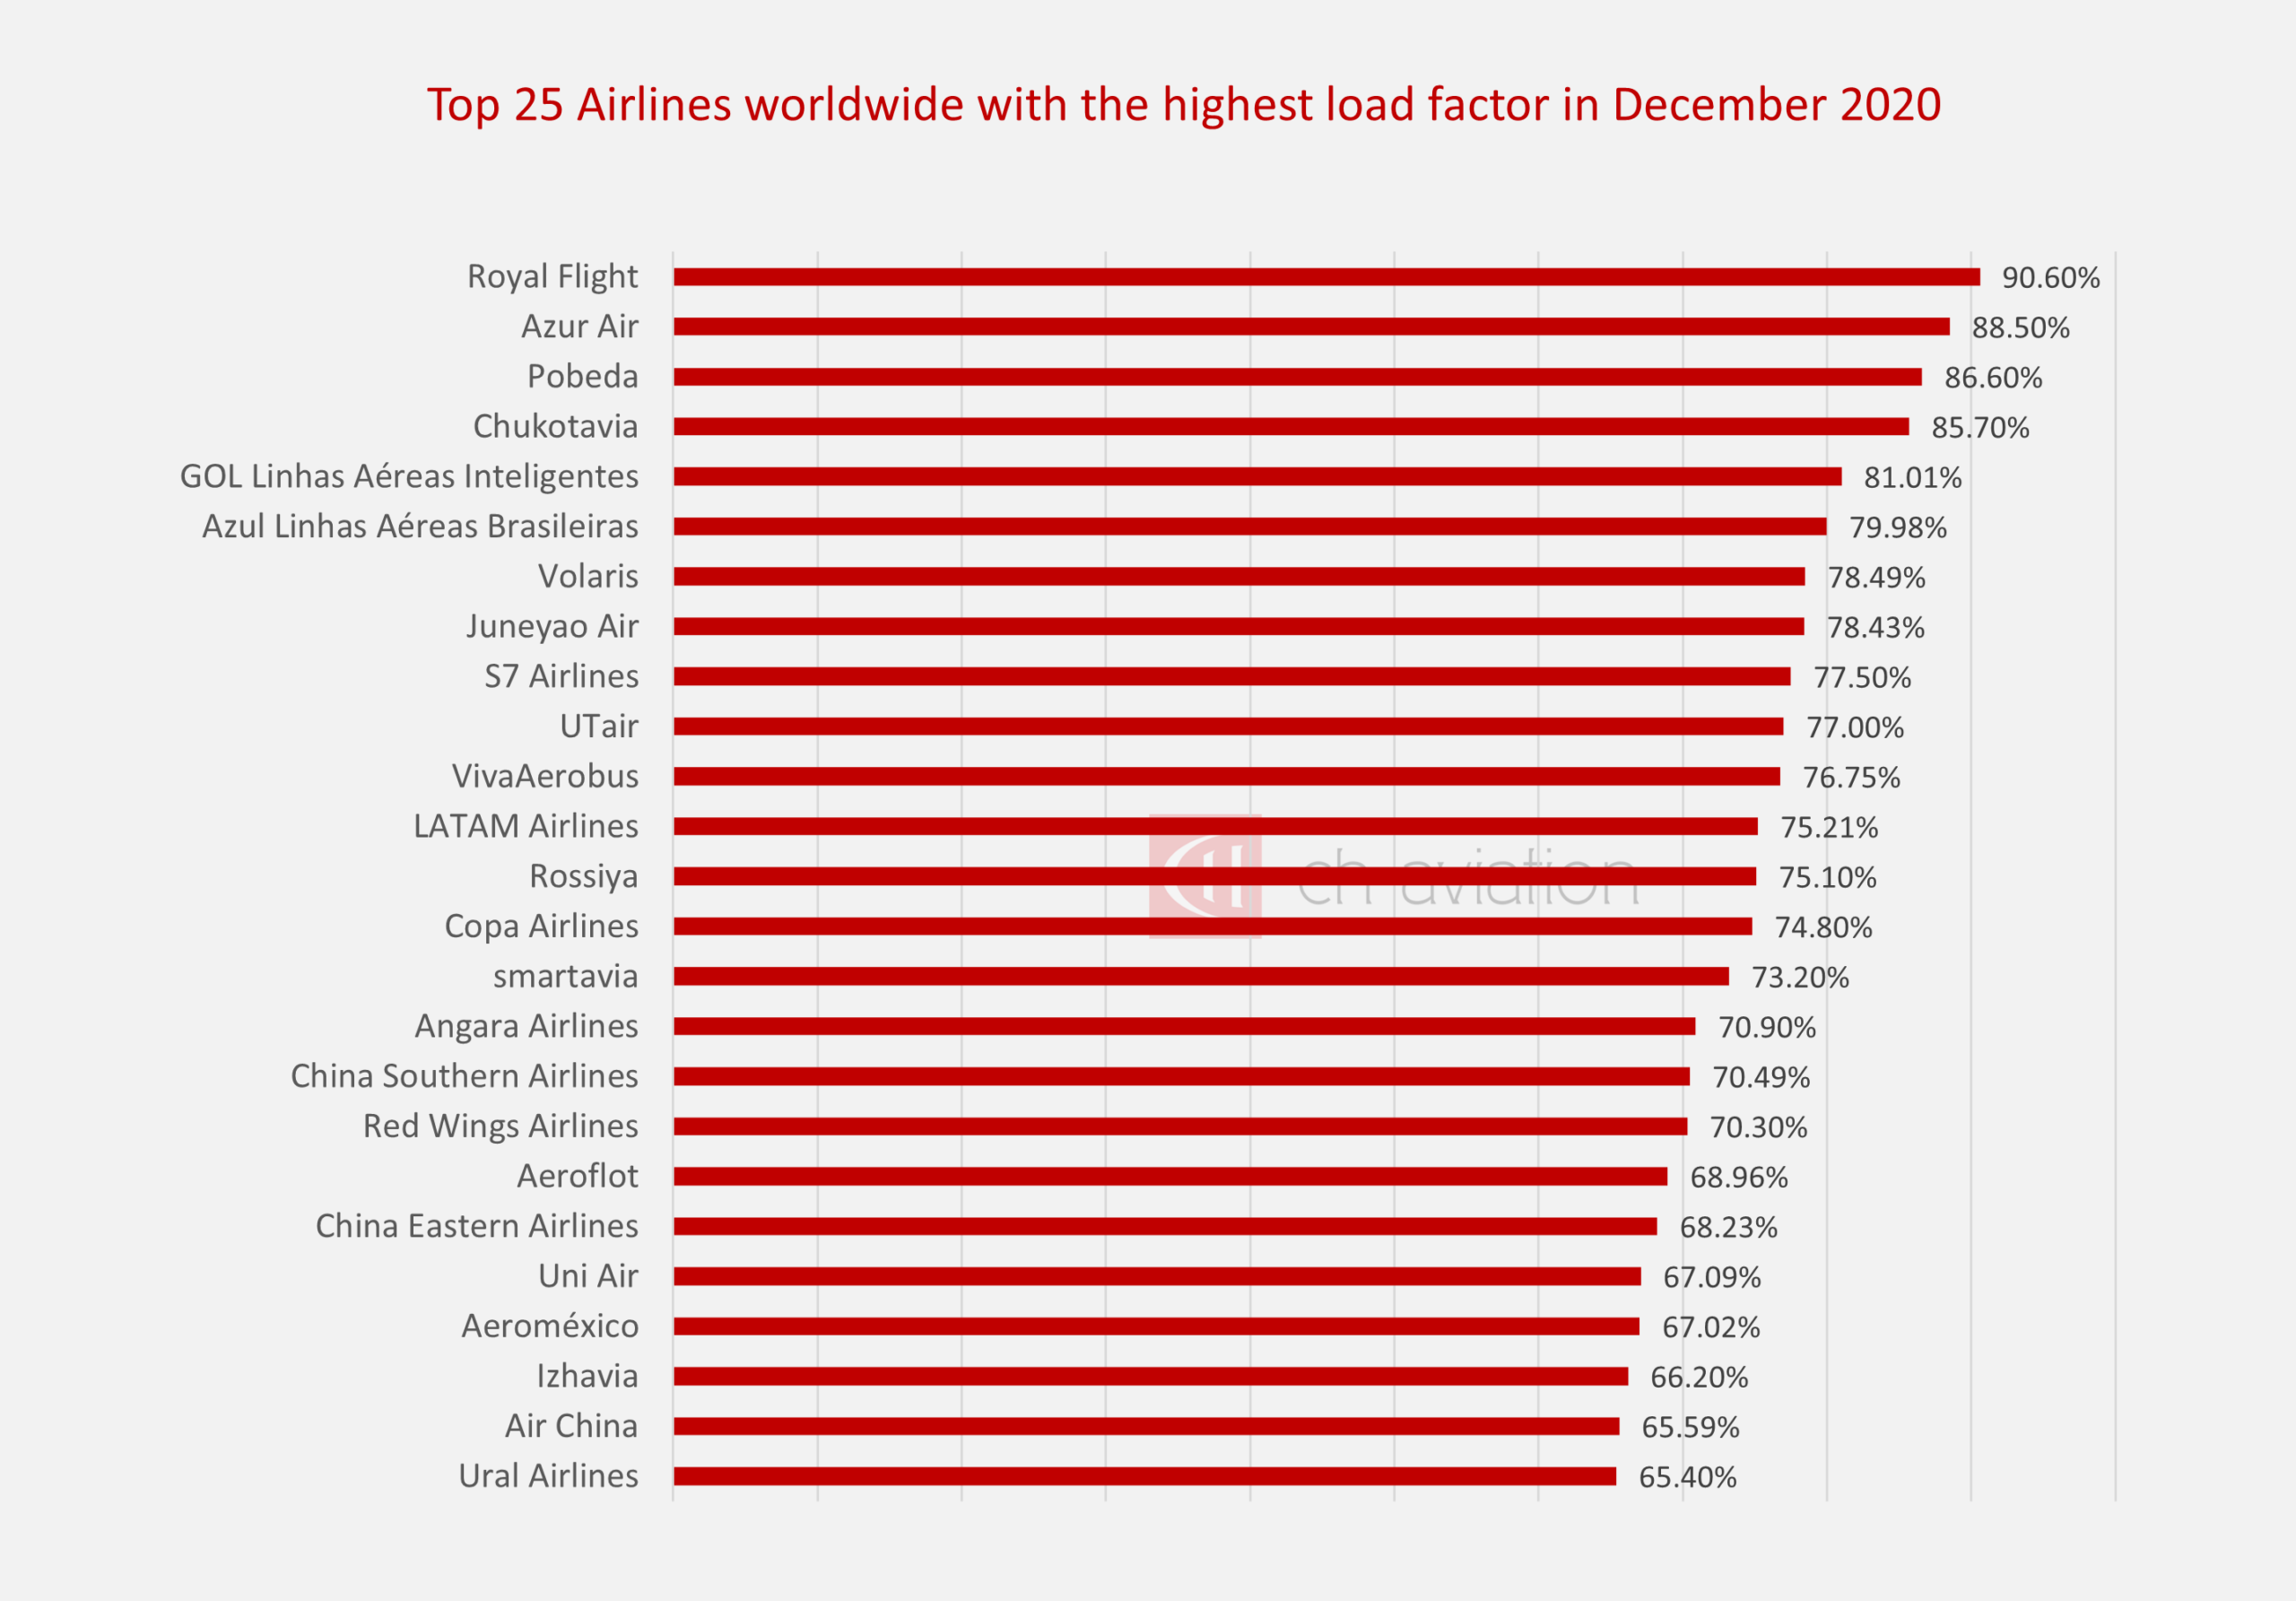
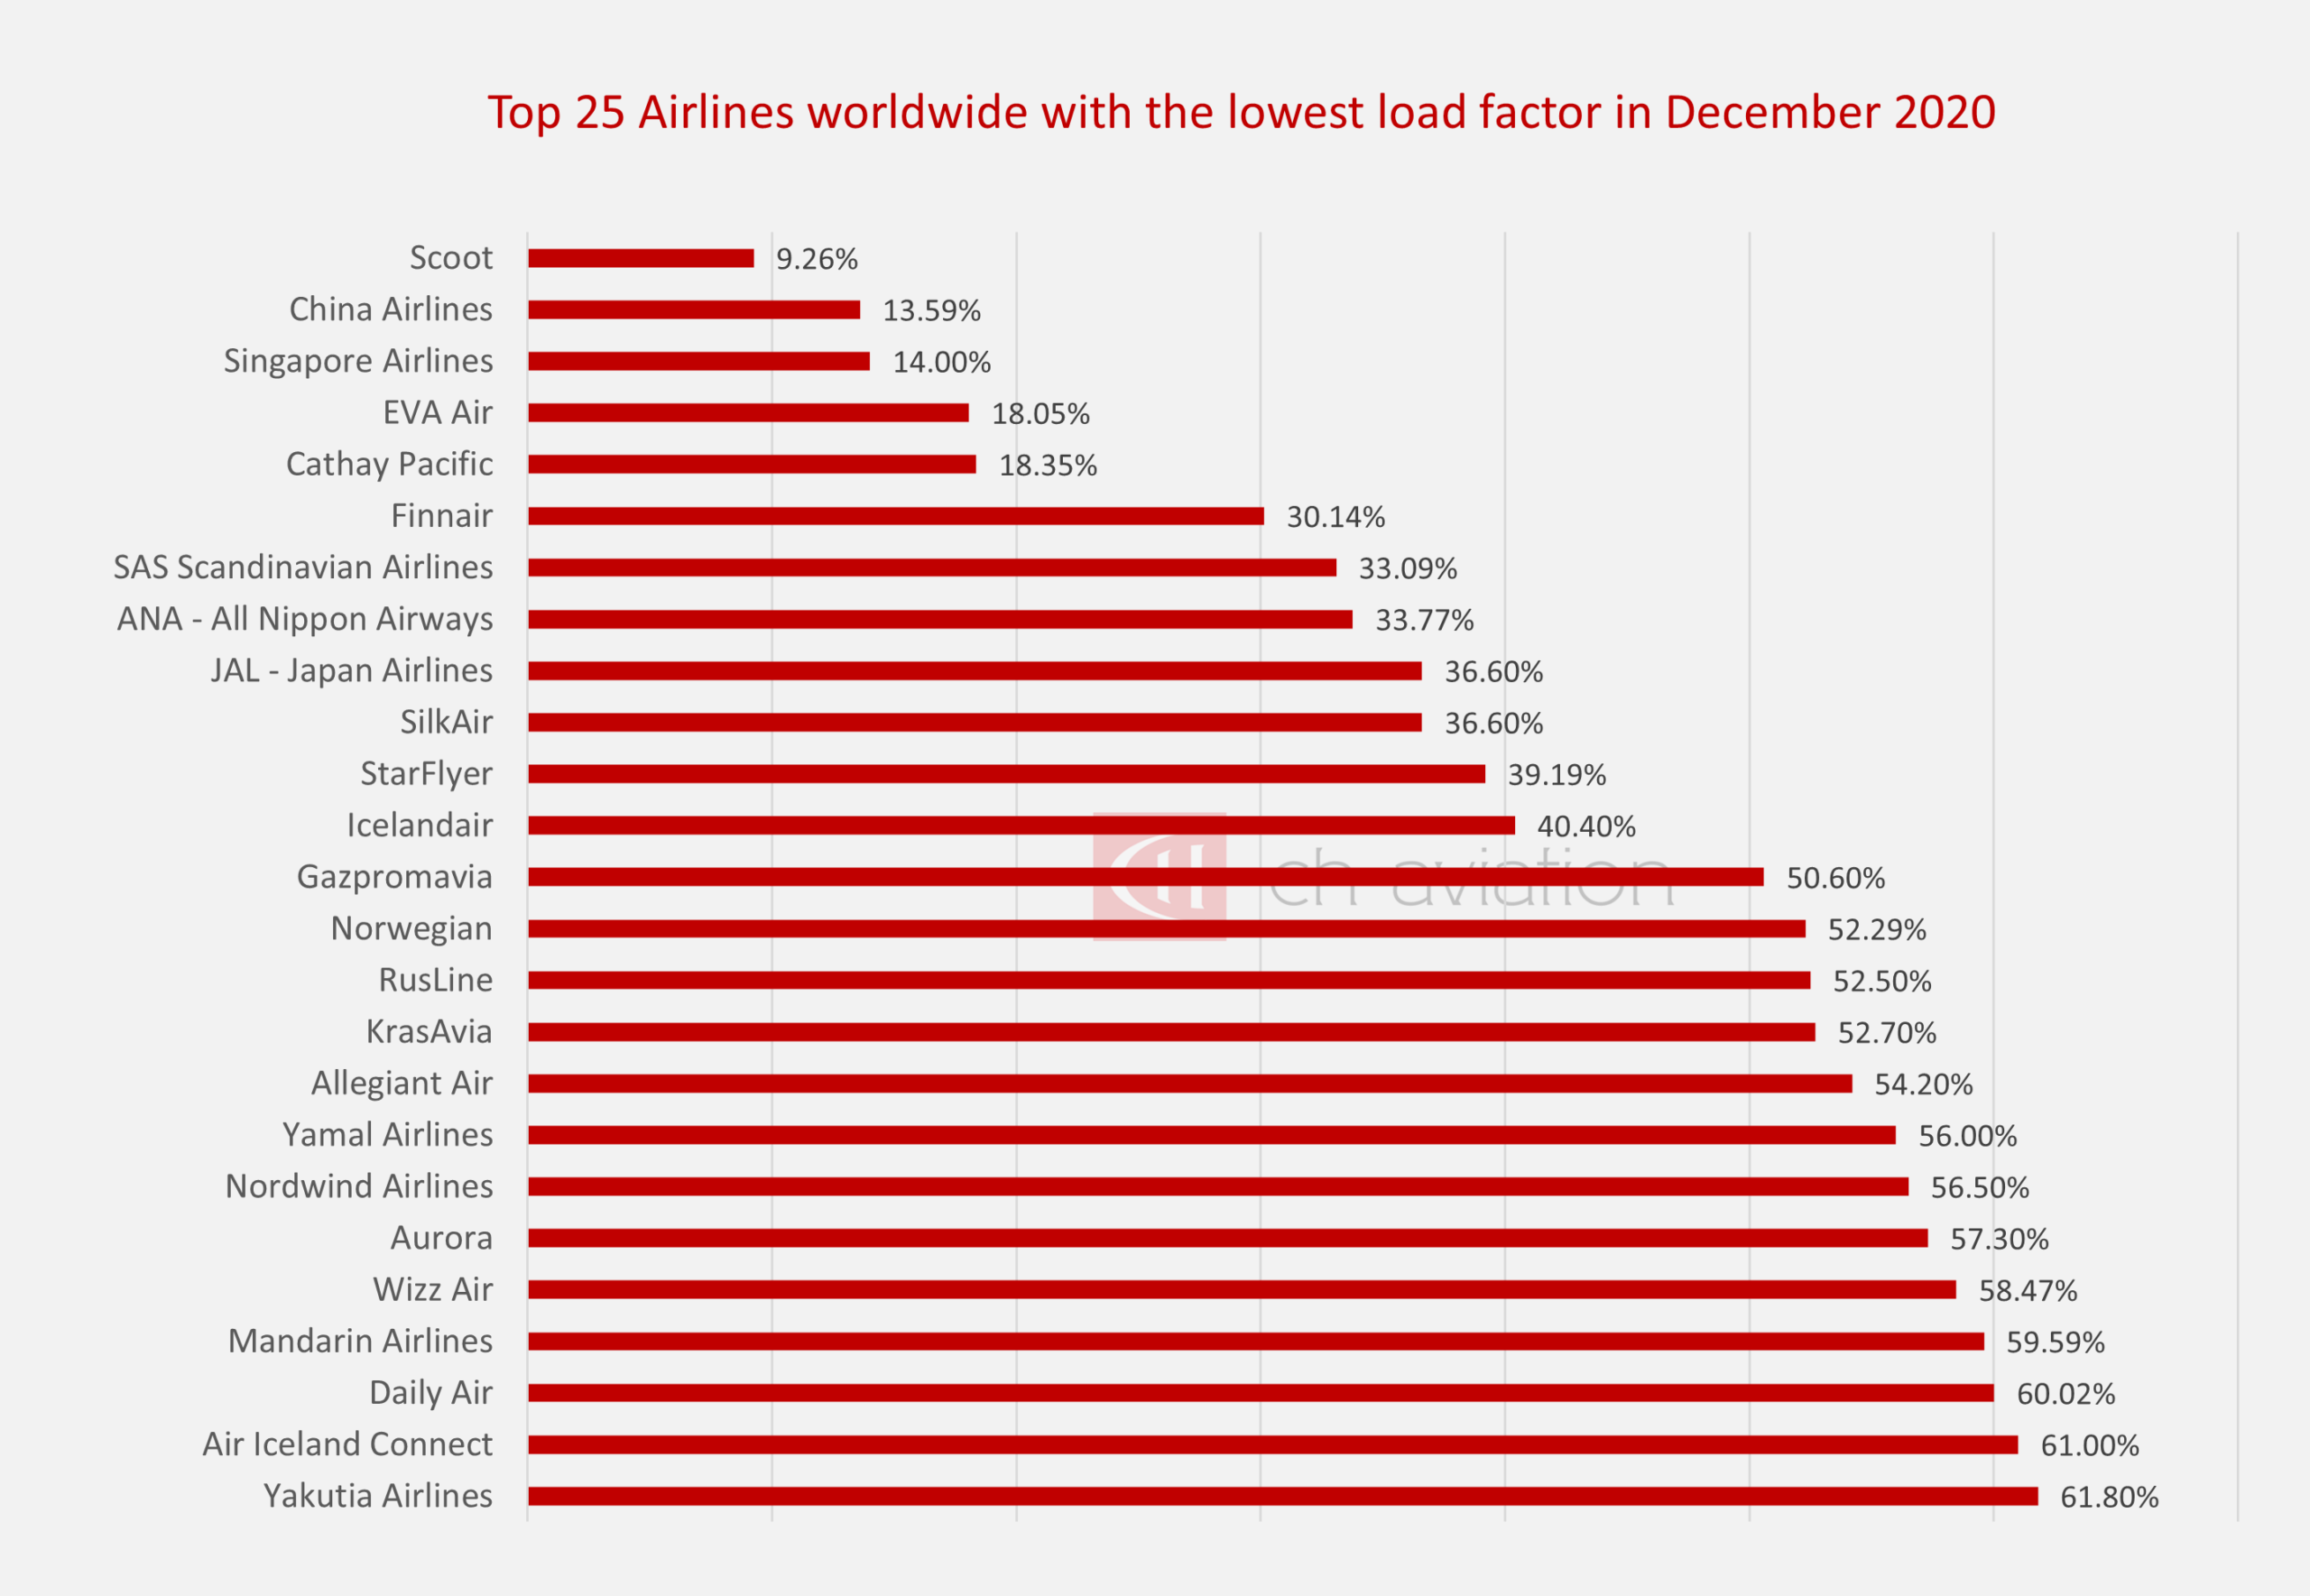
With a load factor of 90.60%, Royal Flight from Russia leads the Top 25 Airlines list with the highest load factors in December 2020. The lowest load factor was tracked by Scoot from Singapore, with 9.26% only.